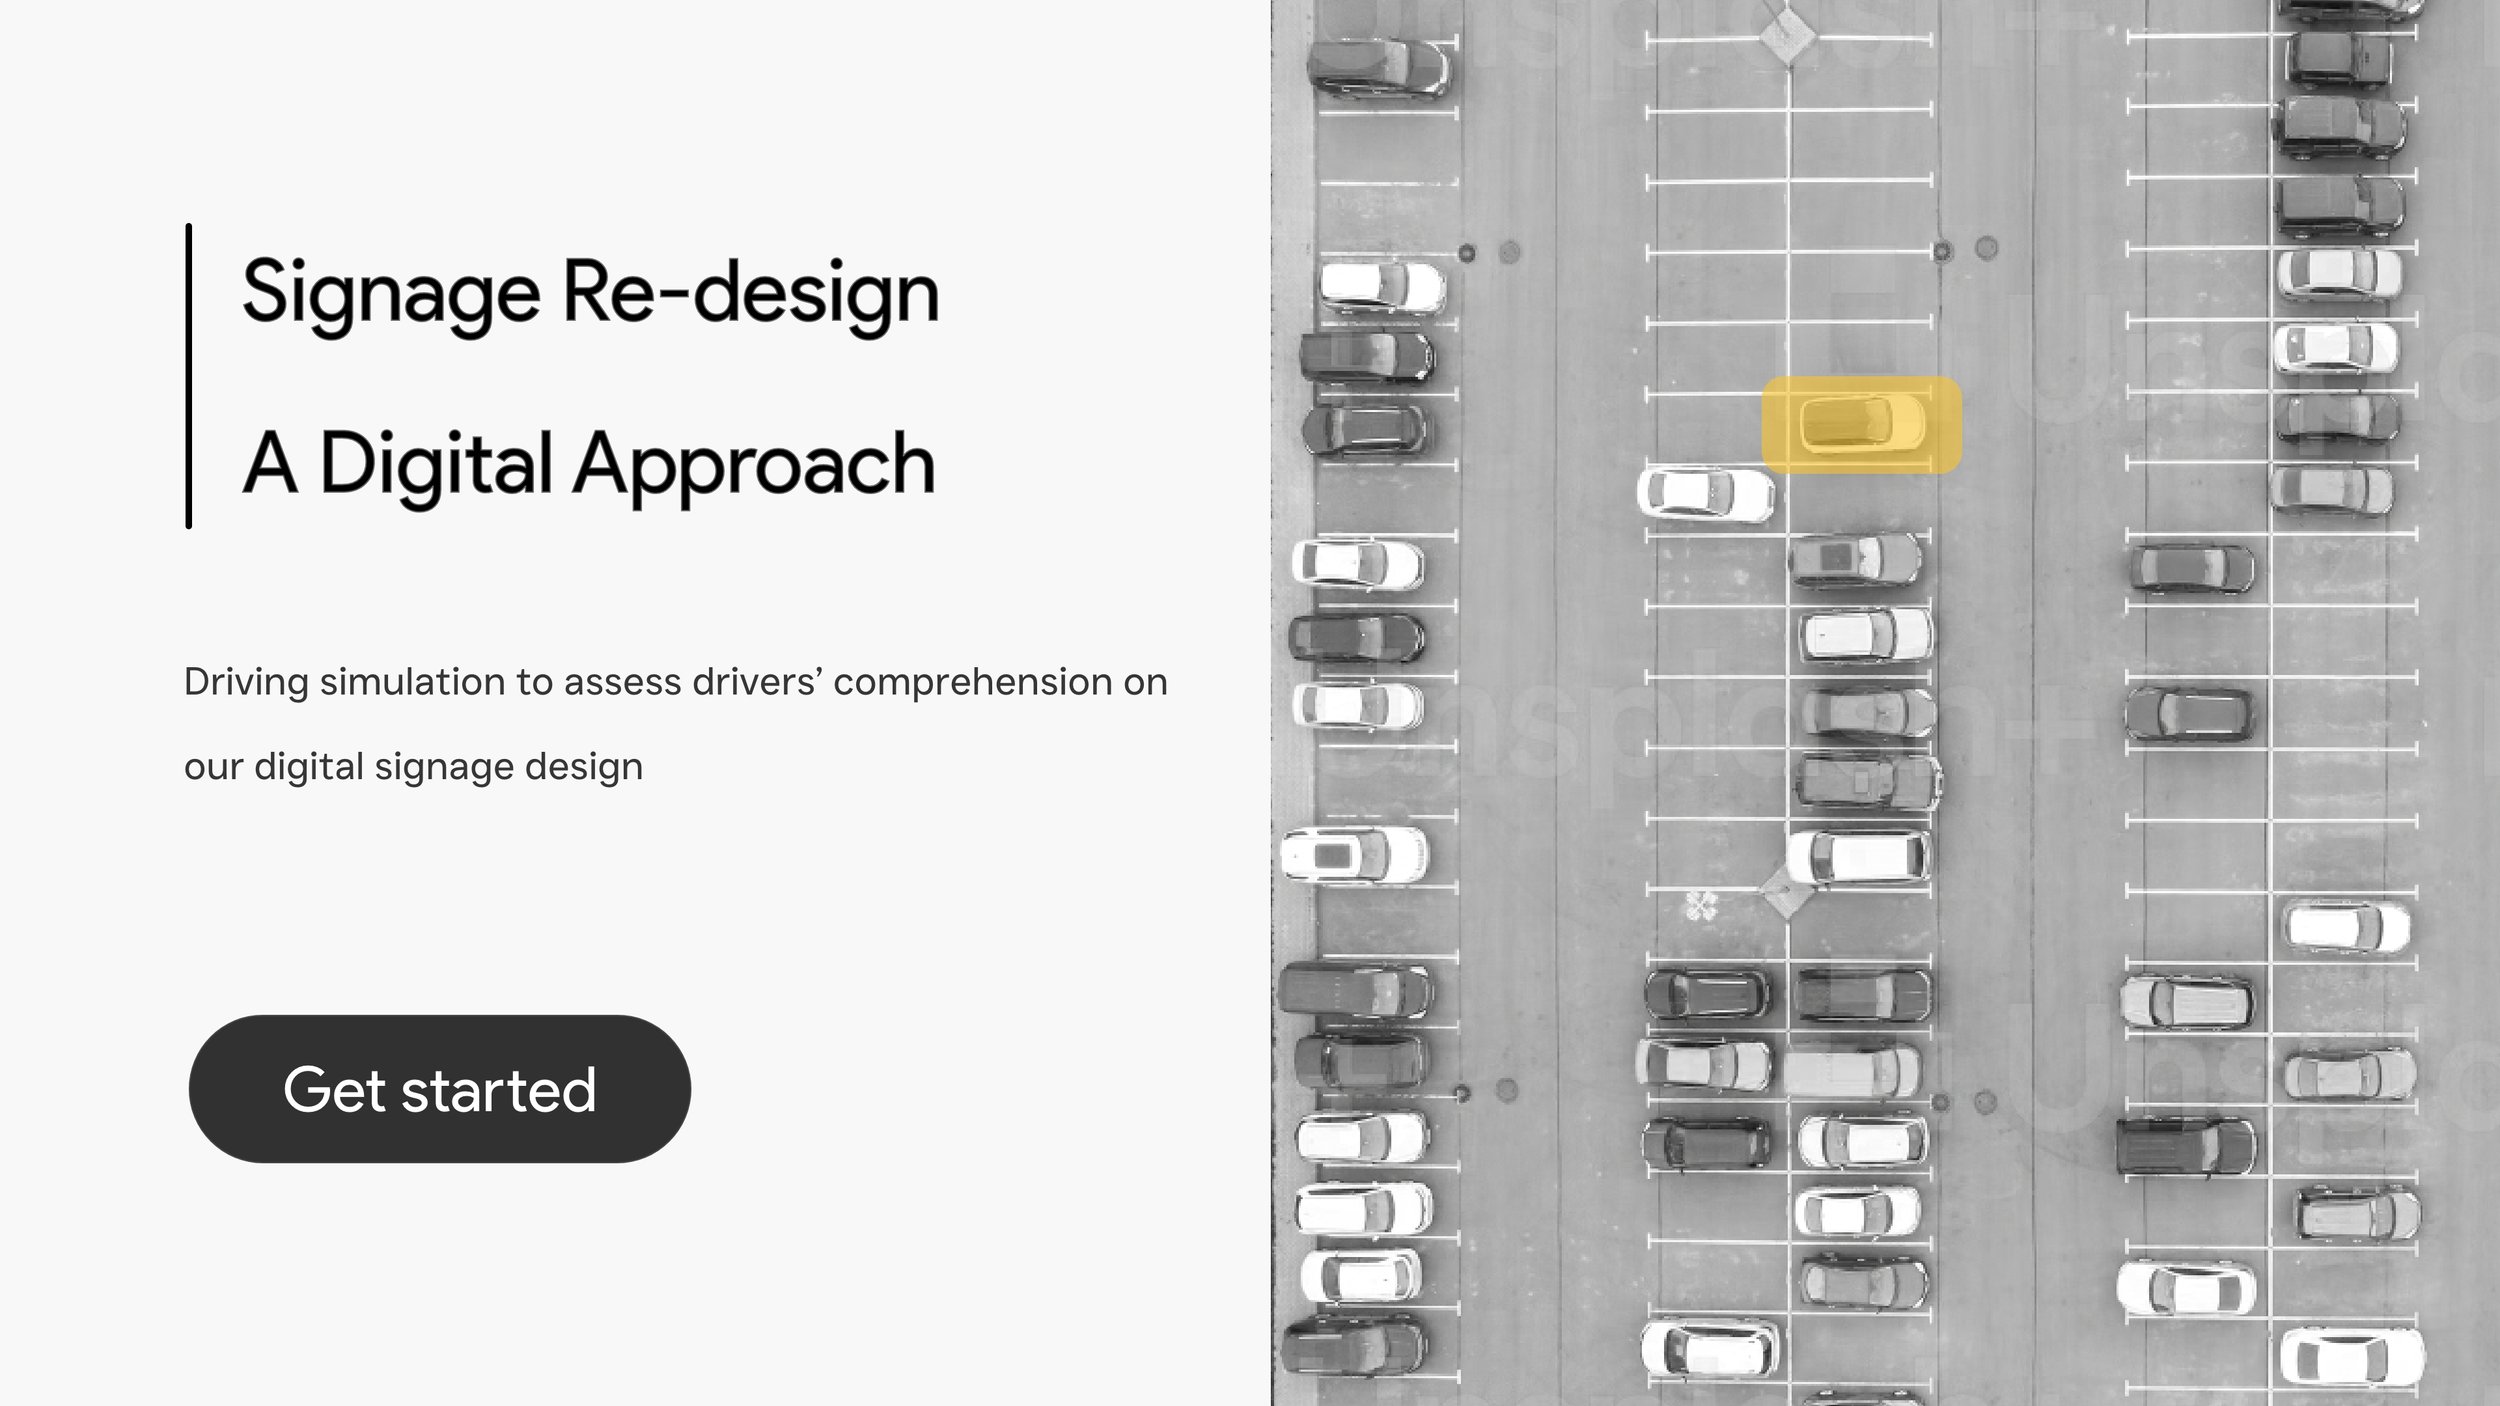
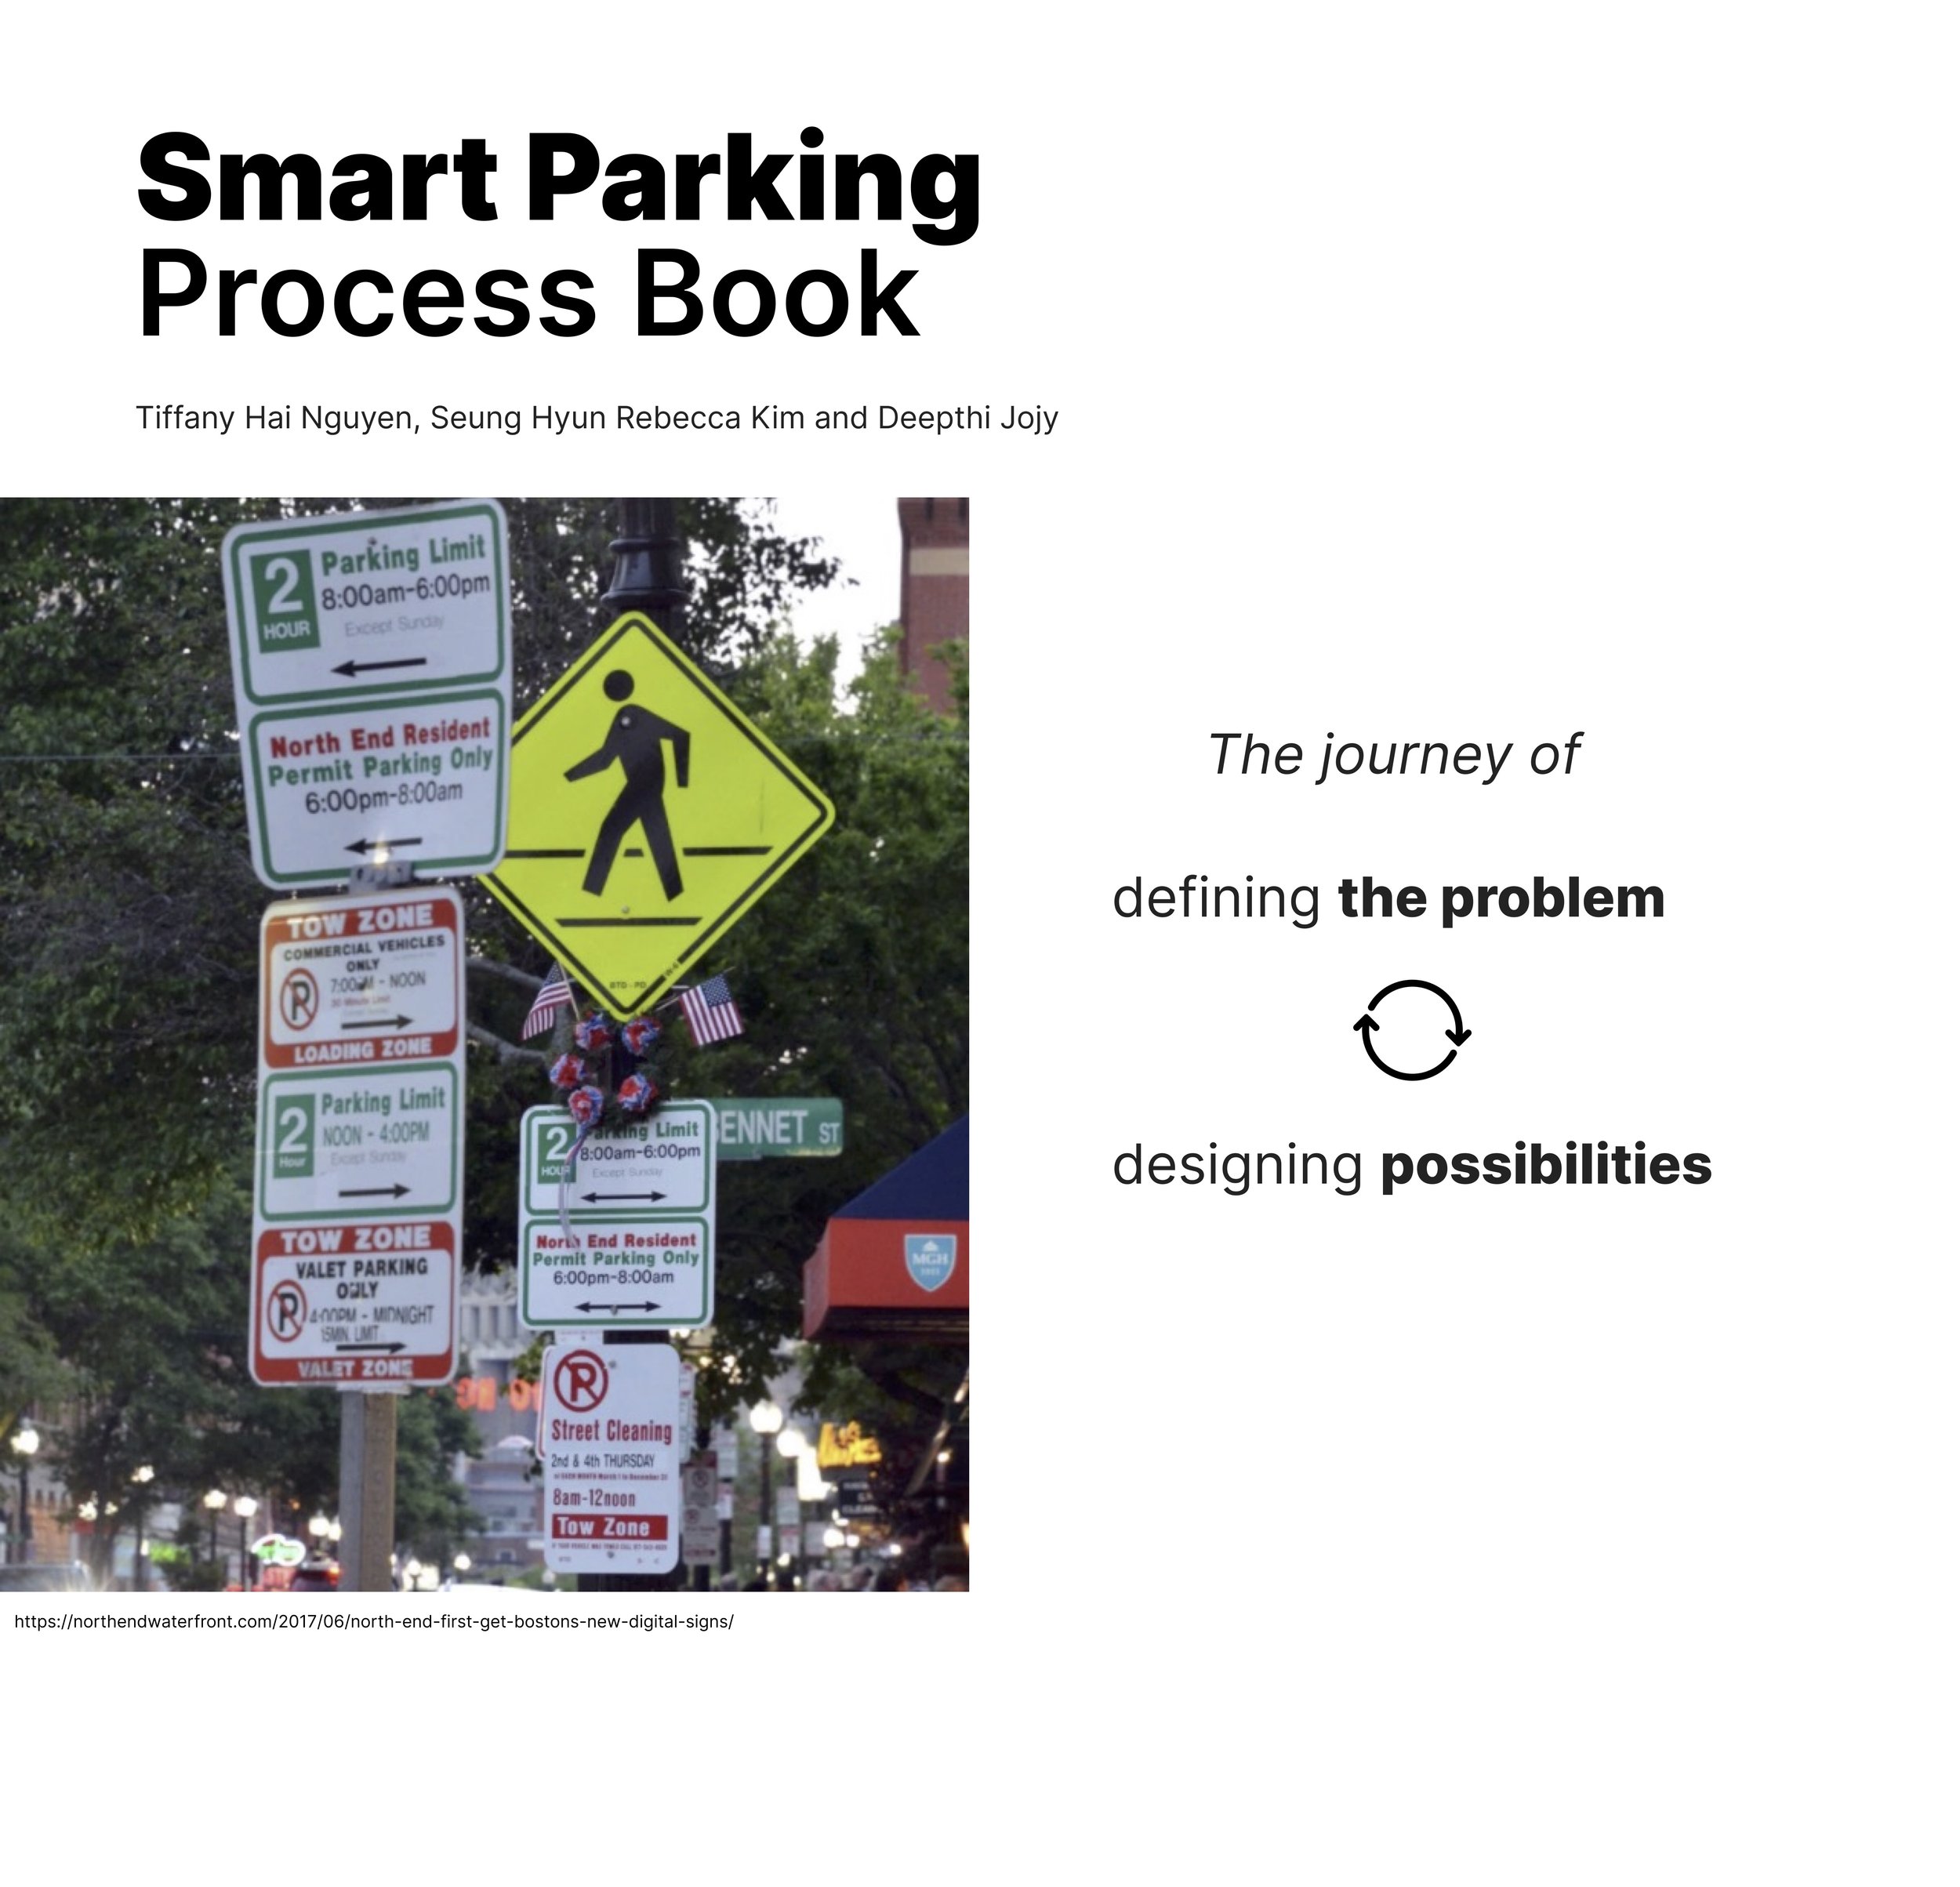
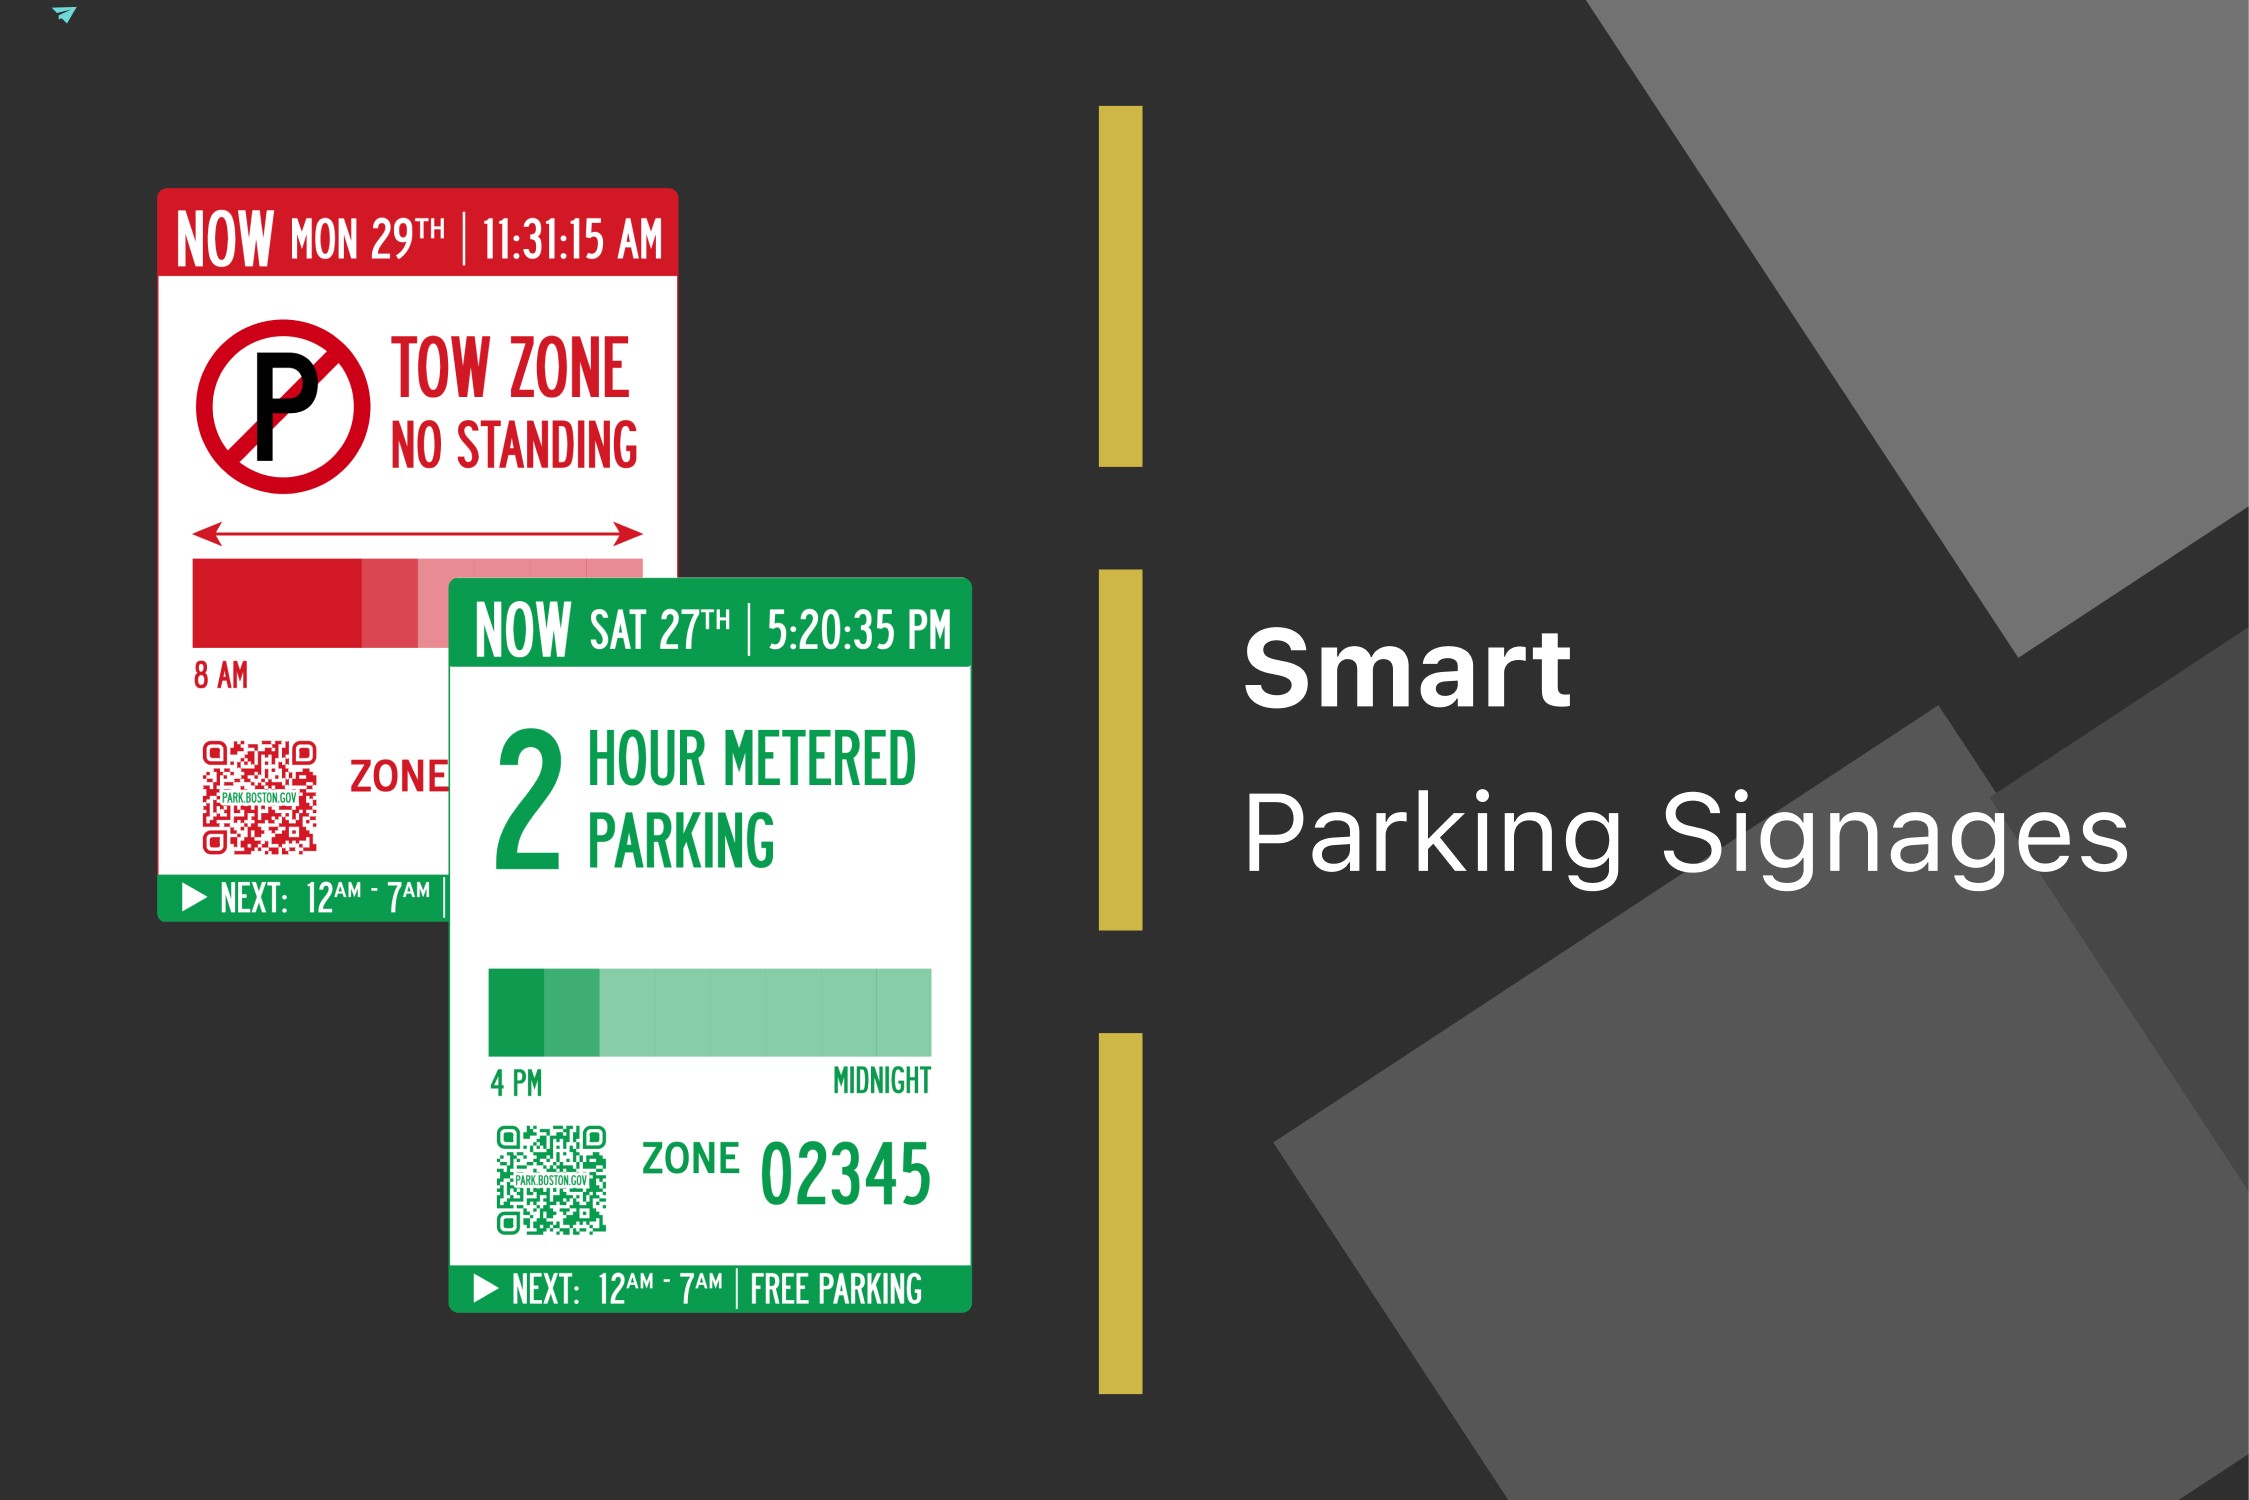
Smart Parking Signage
How might we improve the comprehension speed on street signages for people who park in Downtown Boston?
Timeline
September 2022 - December 2022 (3 months)
Tools
Figma
React
Claude.ai
Team
Tiffany Nguyen
Deepthi Jojy
Rebecca Kim
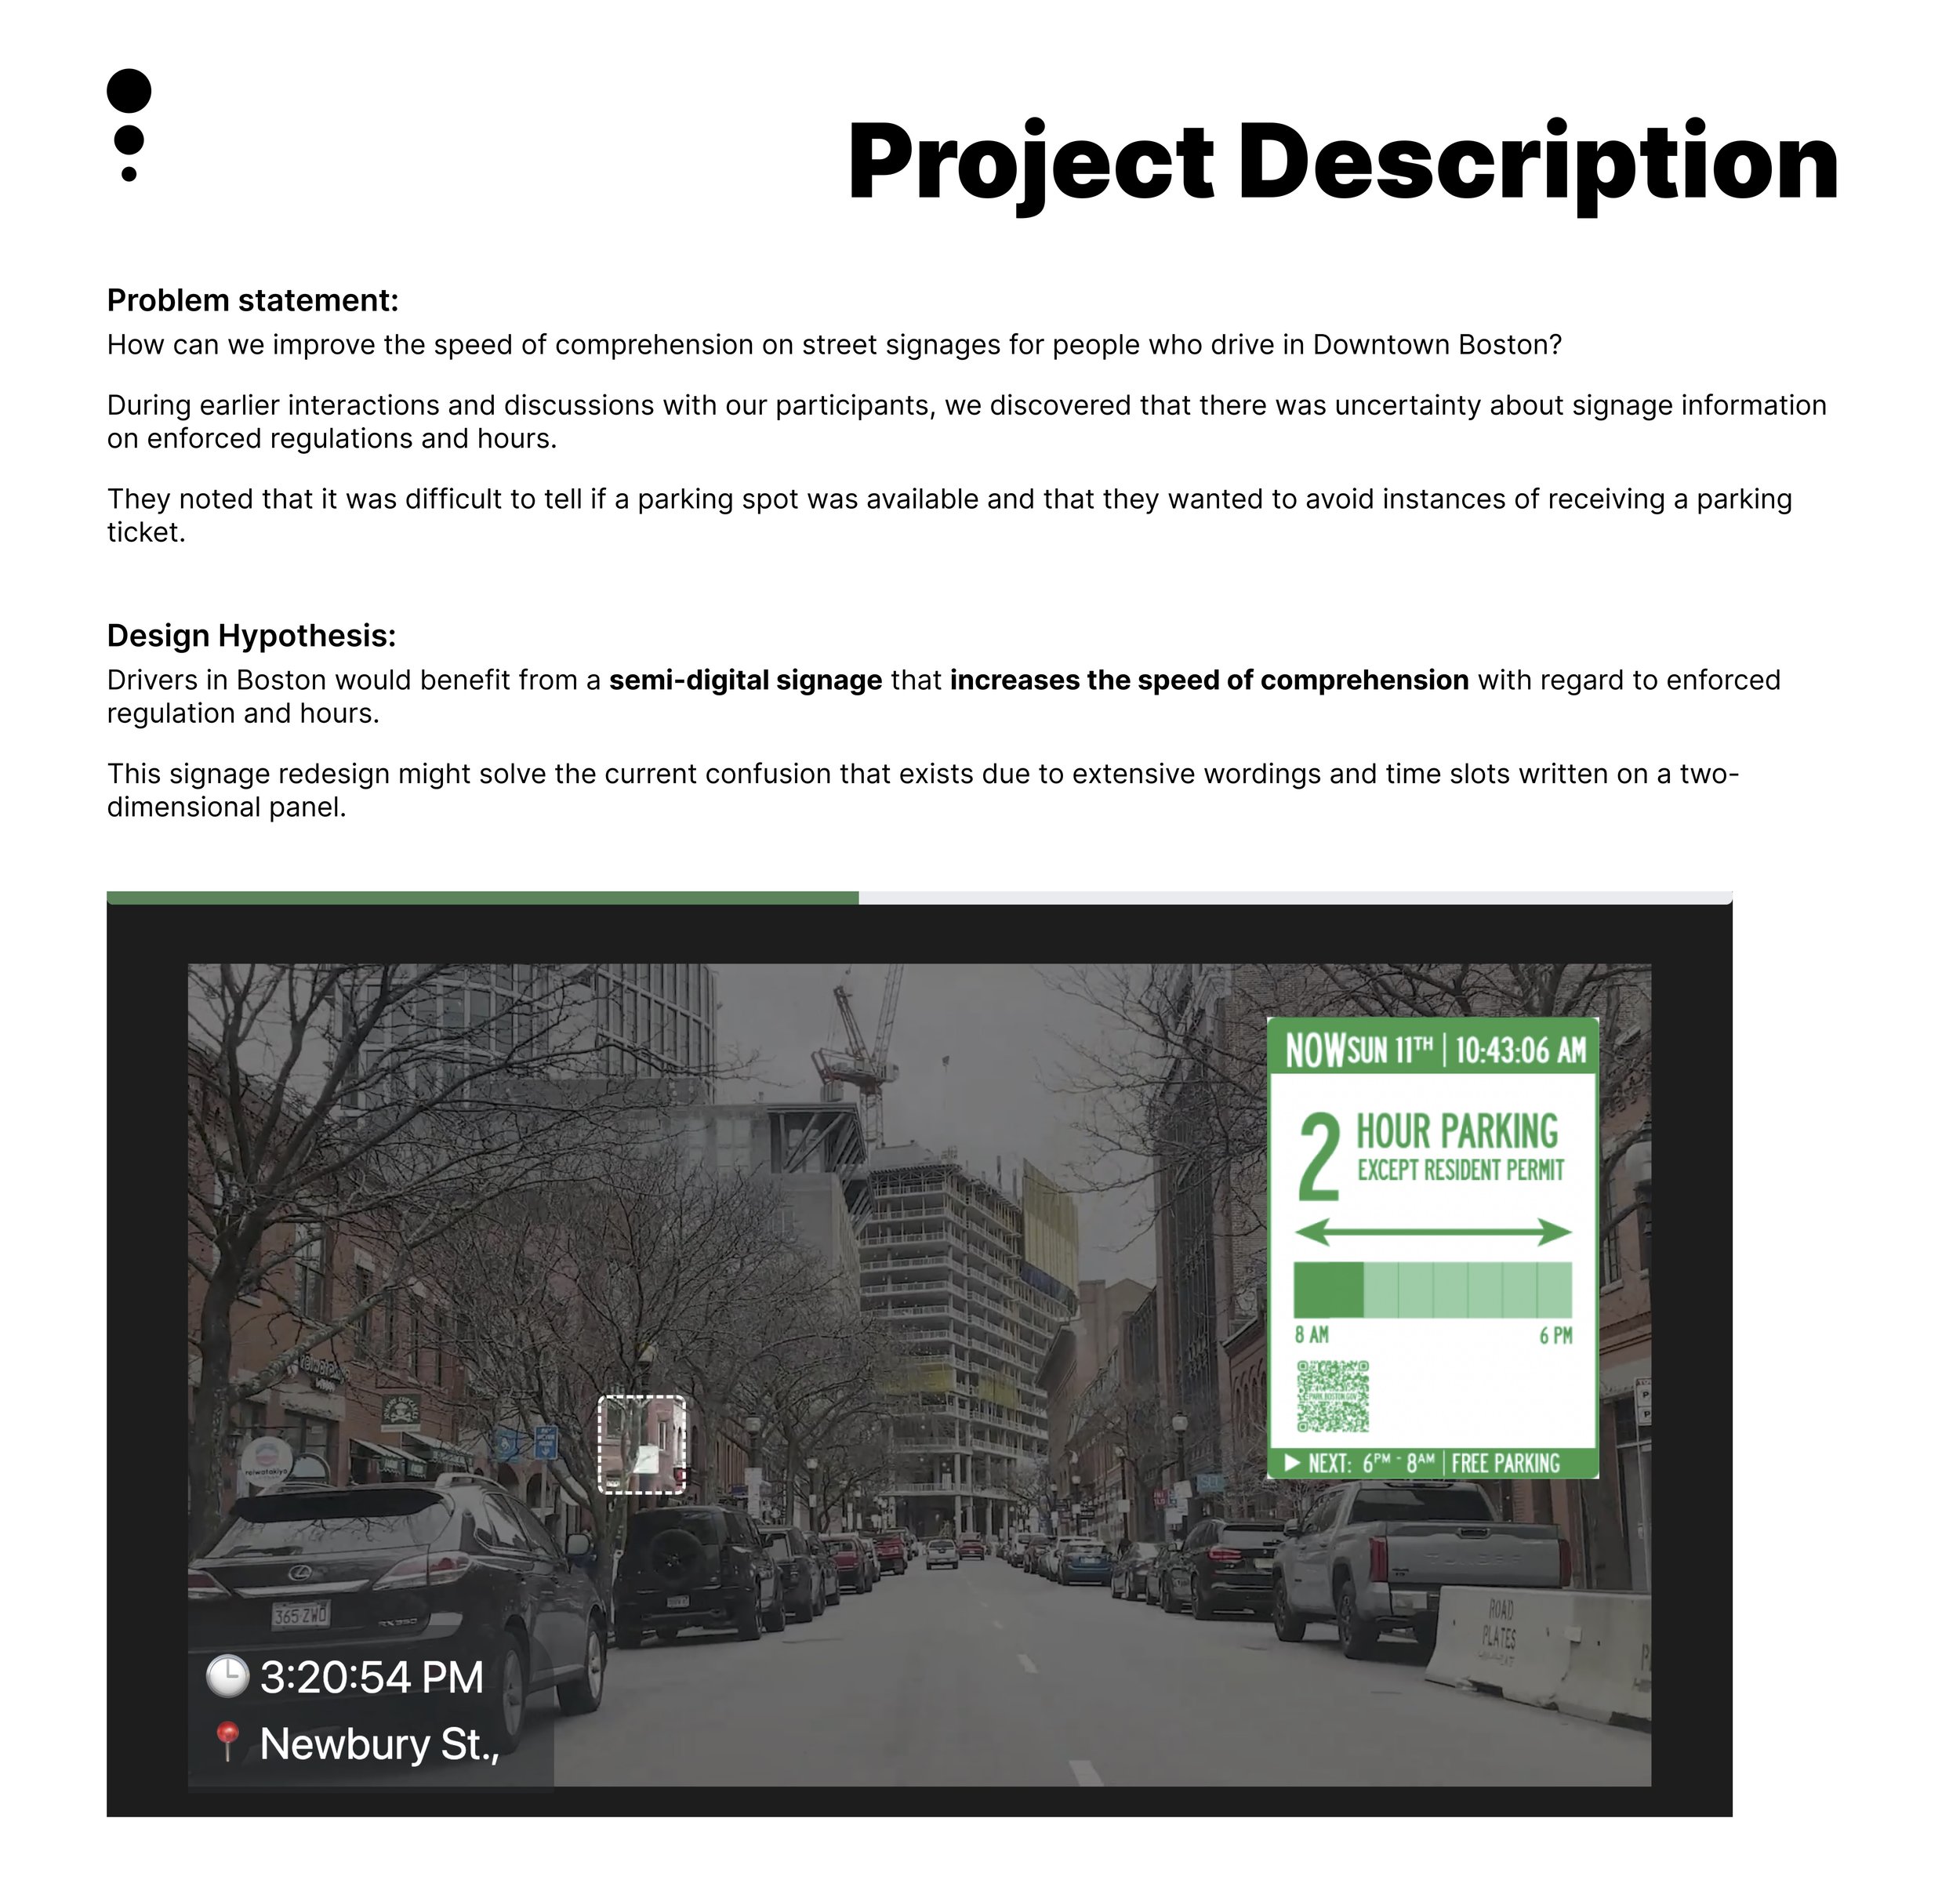
Problem Statement
How can we improve the comprehension speed of street signages for people who park in Downtown Boston?
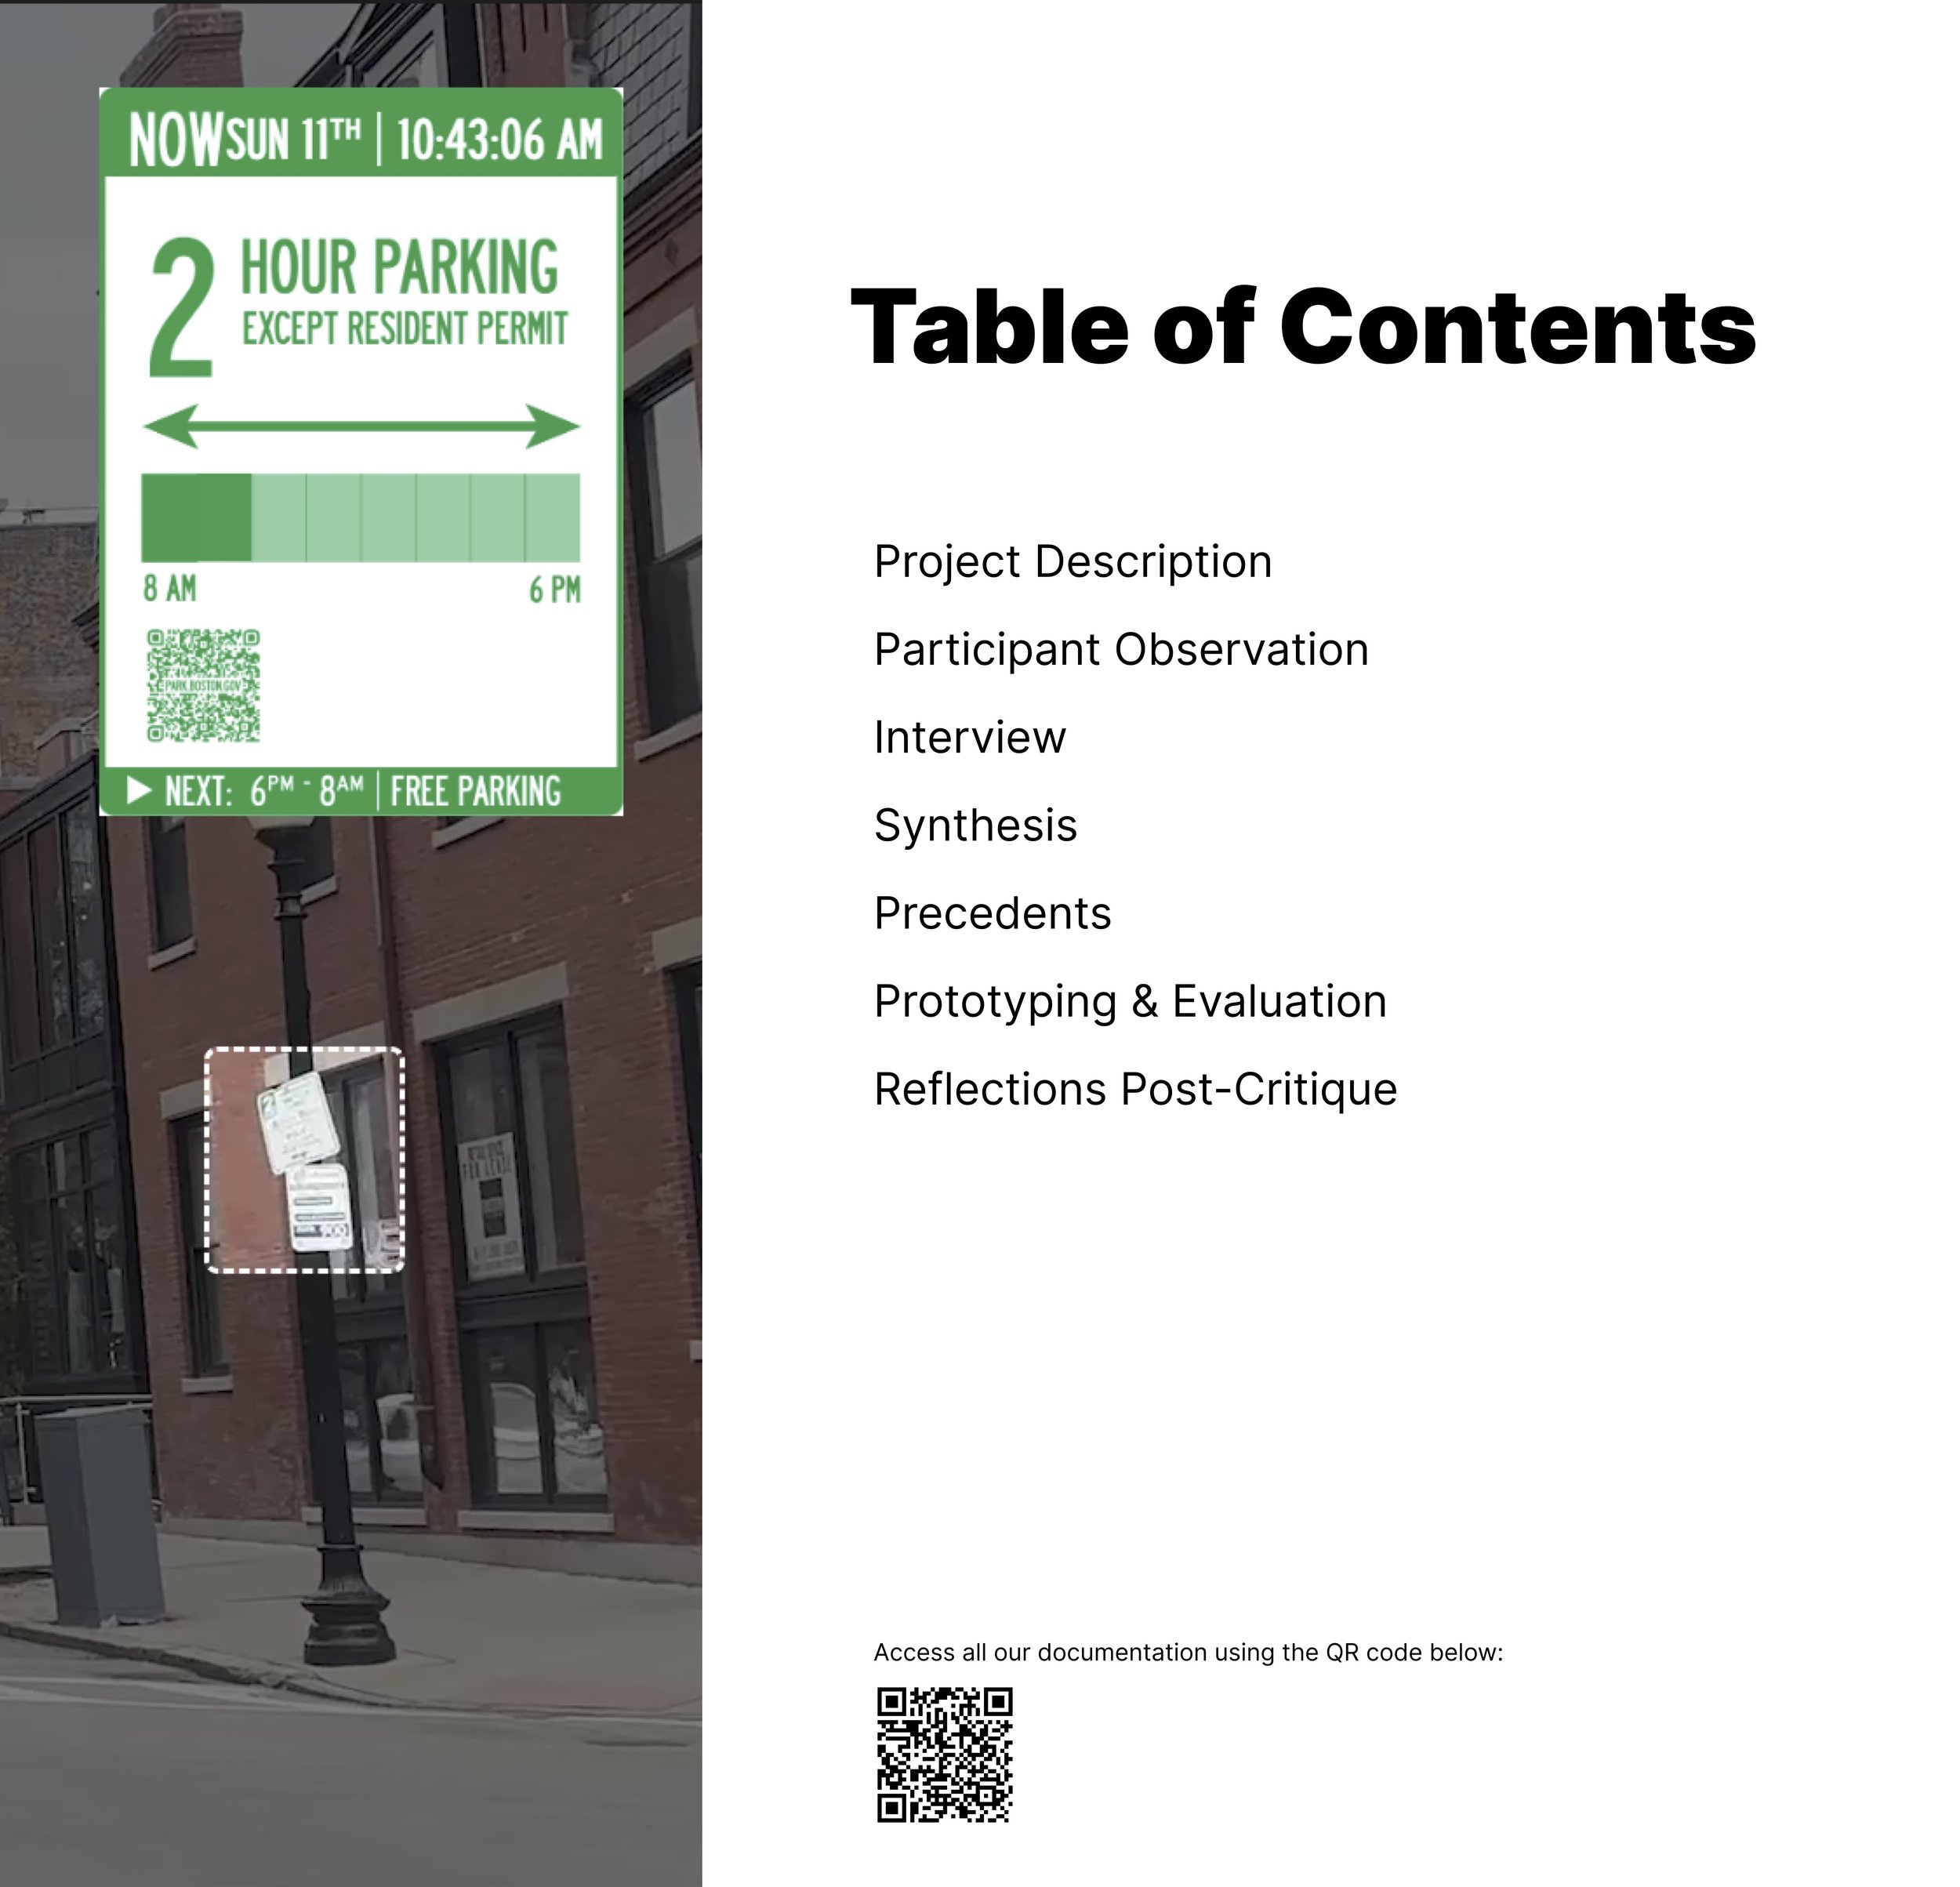
Concept Overview
Finding street or public parking during peak hours is a common challenge for residents of big cities, including Boston. Options for drivers are often limited: circling the block in search of an available spot or paying a high fee for parking services. This time-consuming process can take over an hour, potentially ruining an otherwise enjoyable weekend.
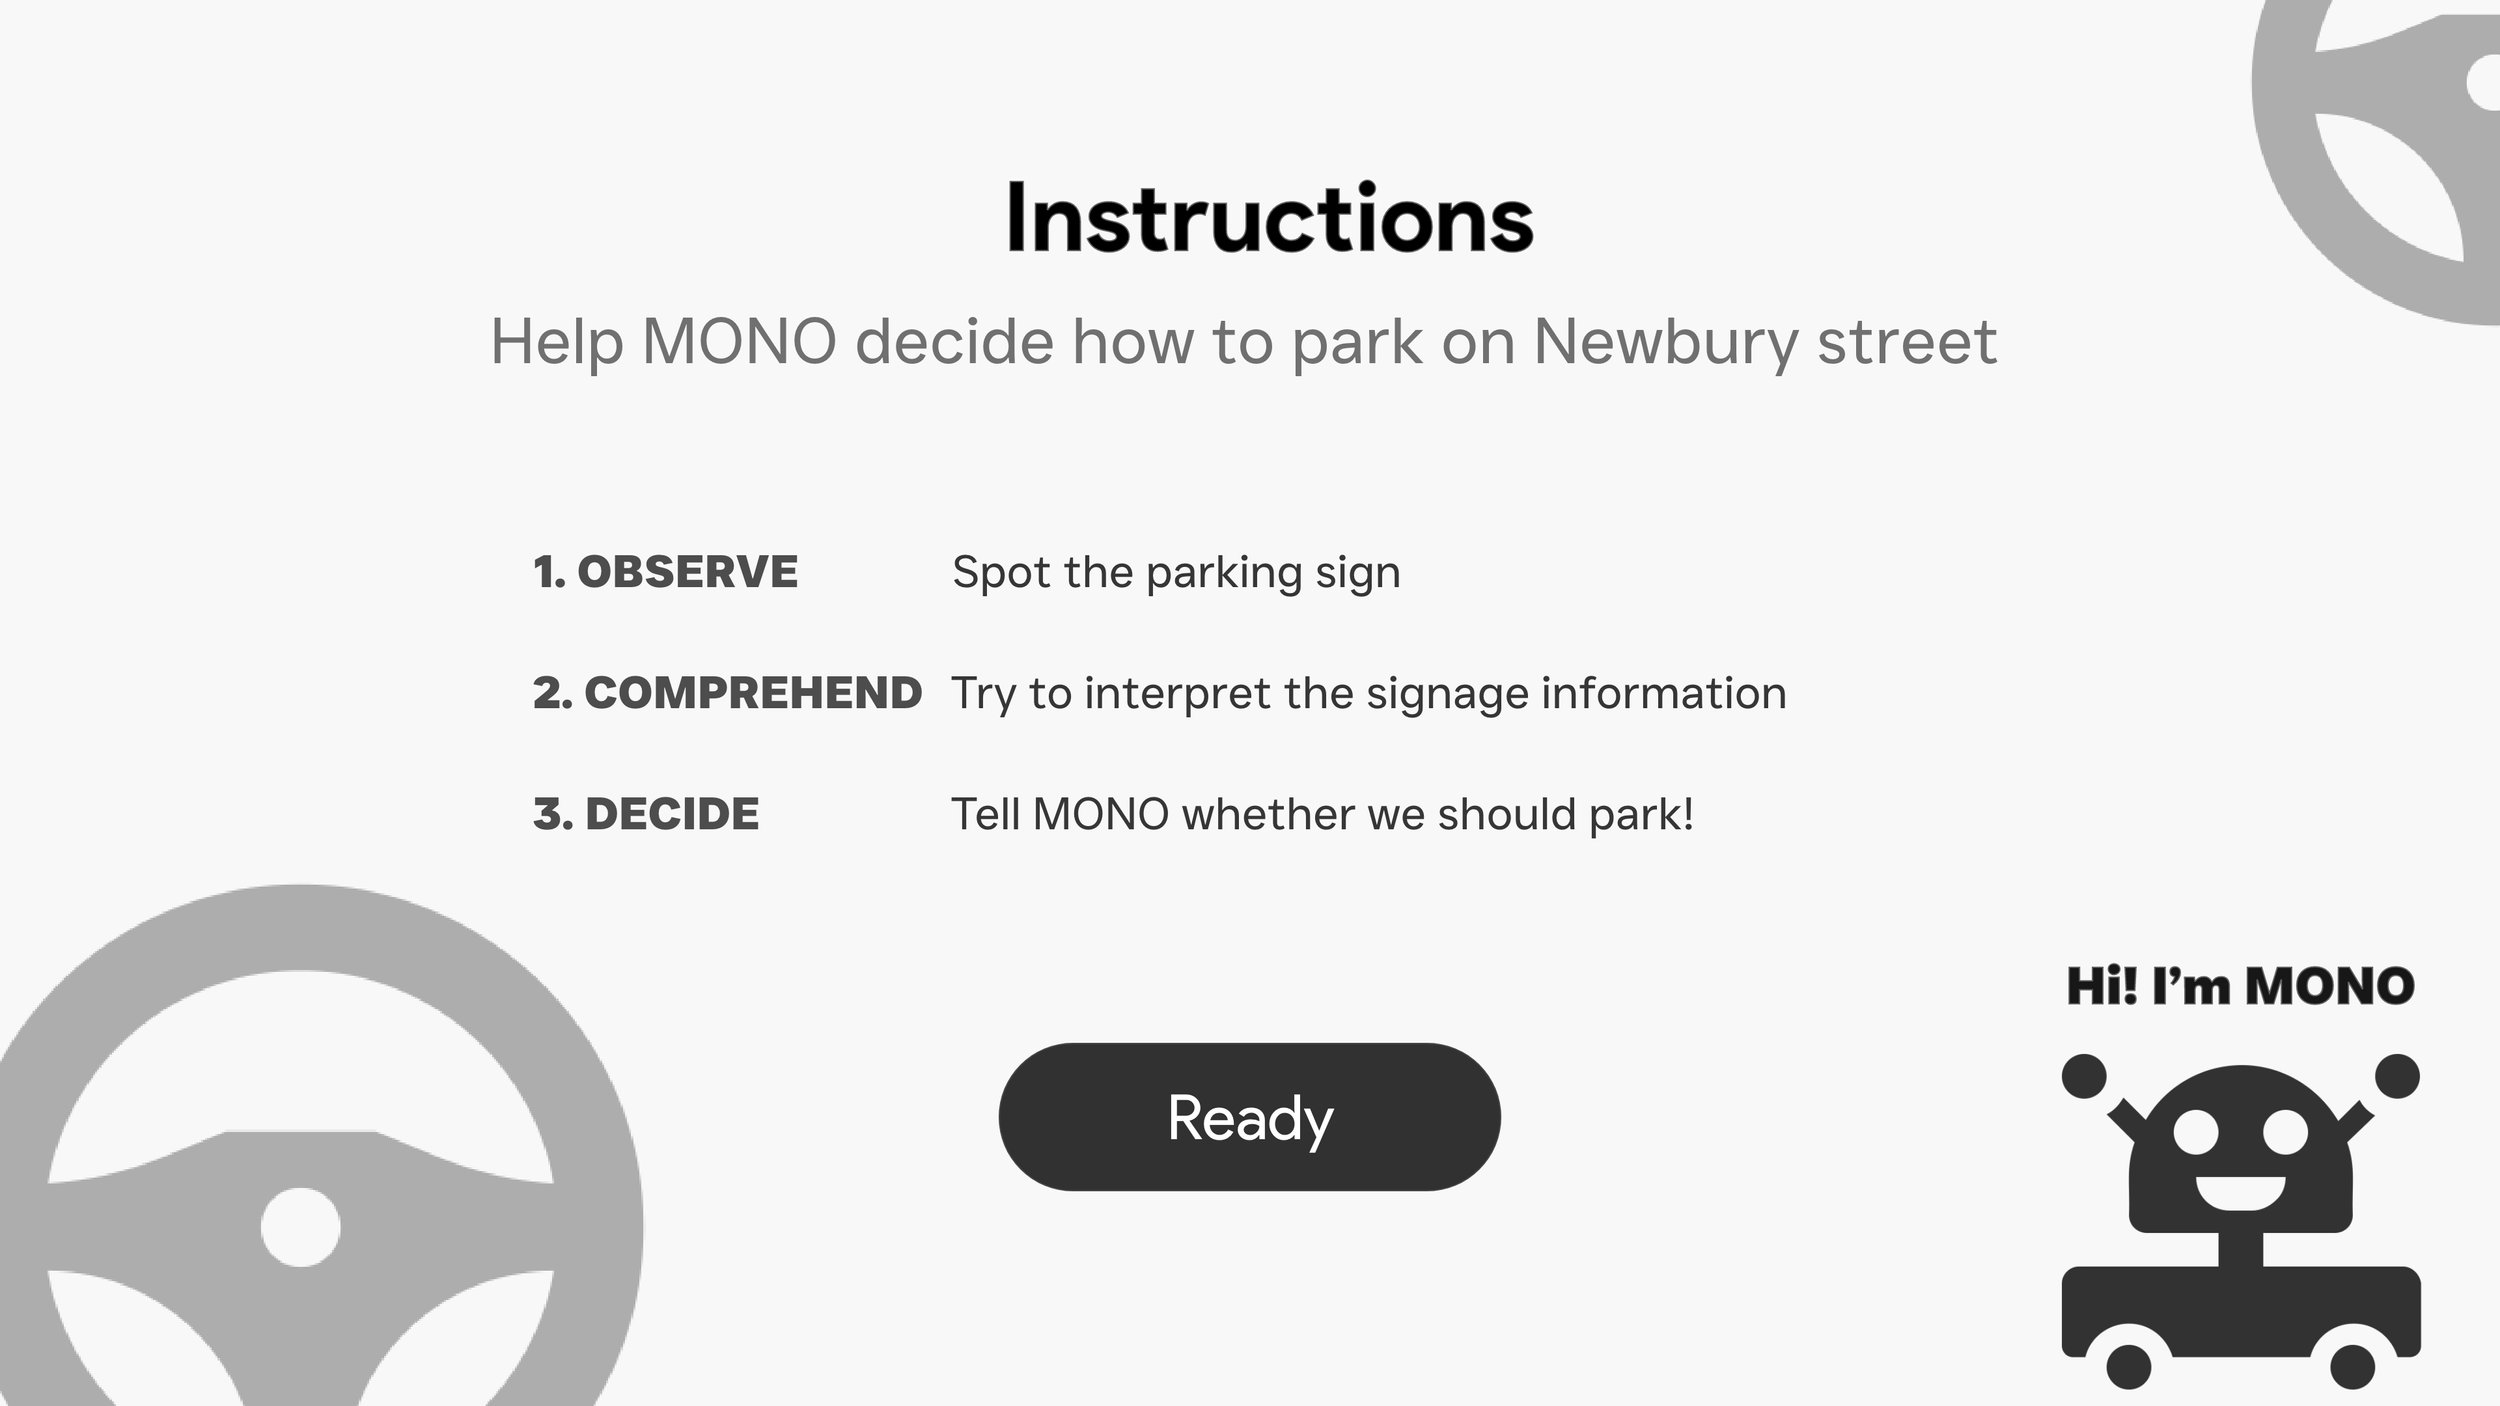
Our Goal
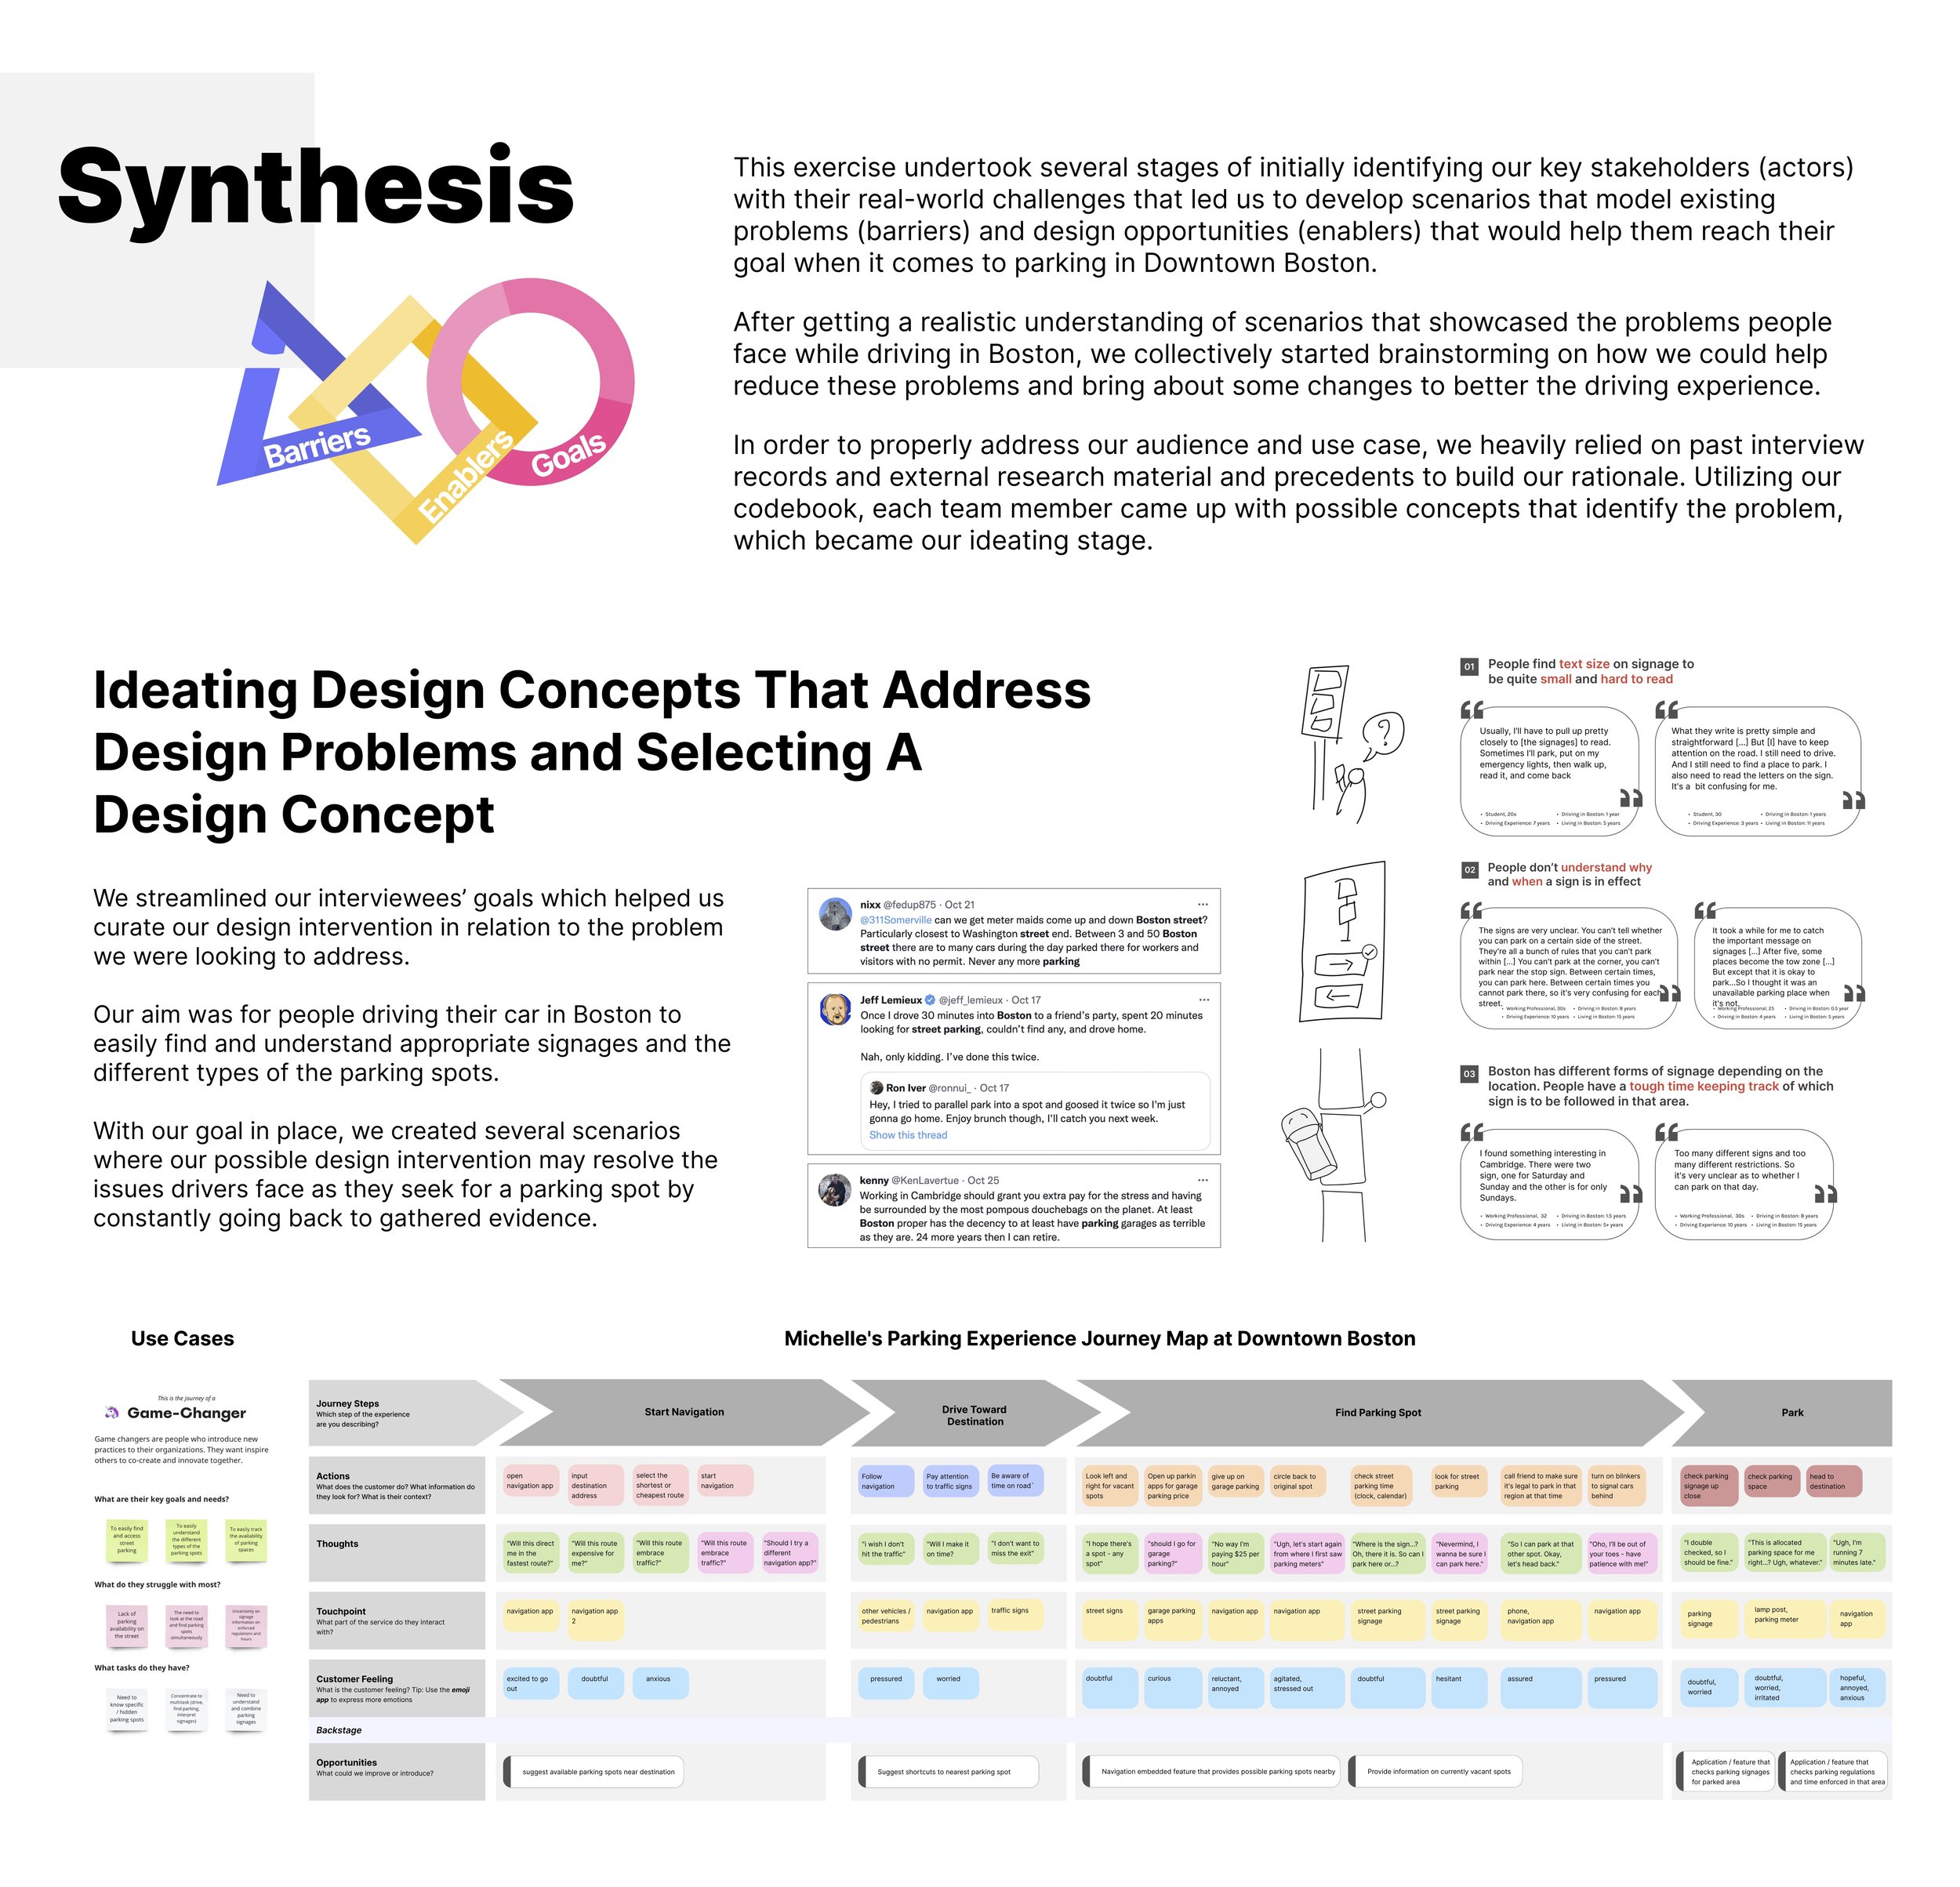
We aim to gather insights from drivers on their experience, from searching for a parking spot to actually parking. Our goal is to test a new approach to the signage system. Specifically, we want to see if providing real-time information on parking availability can enhance drivers' comprehension speed.
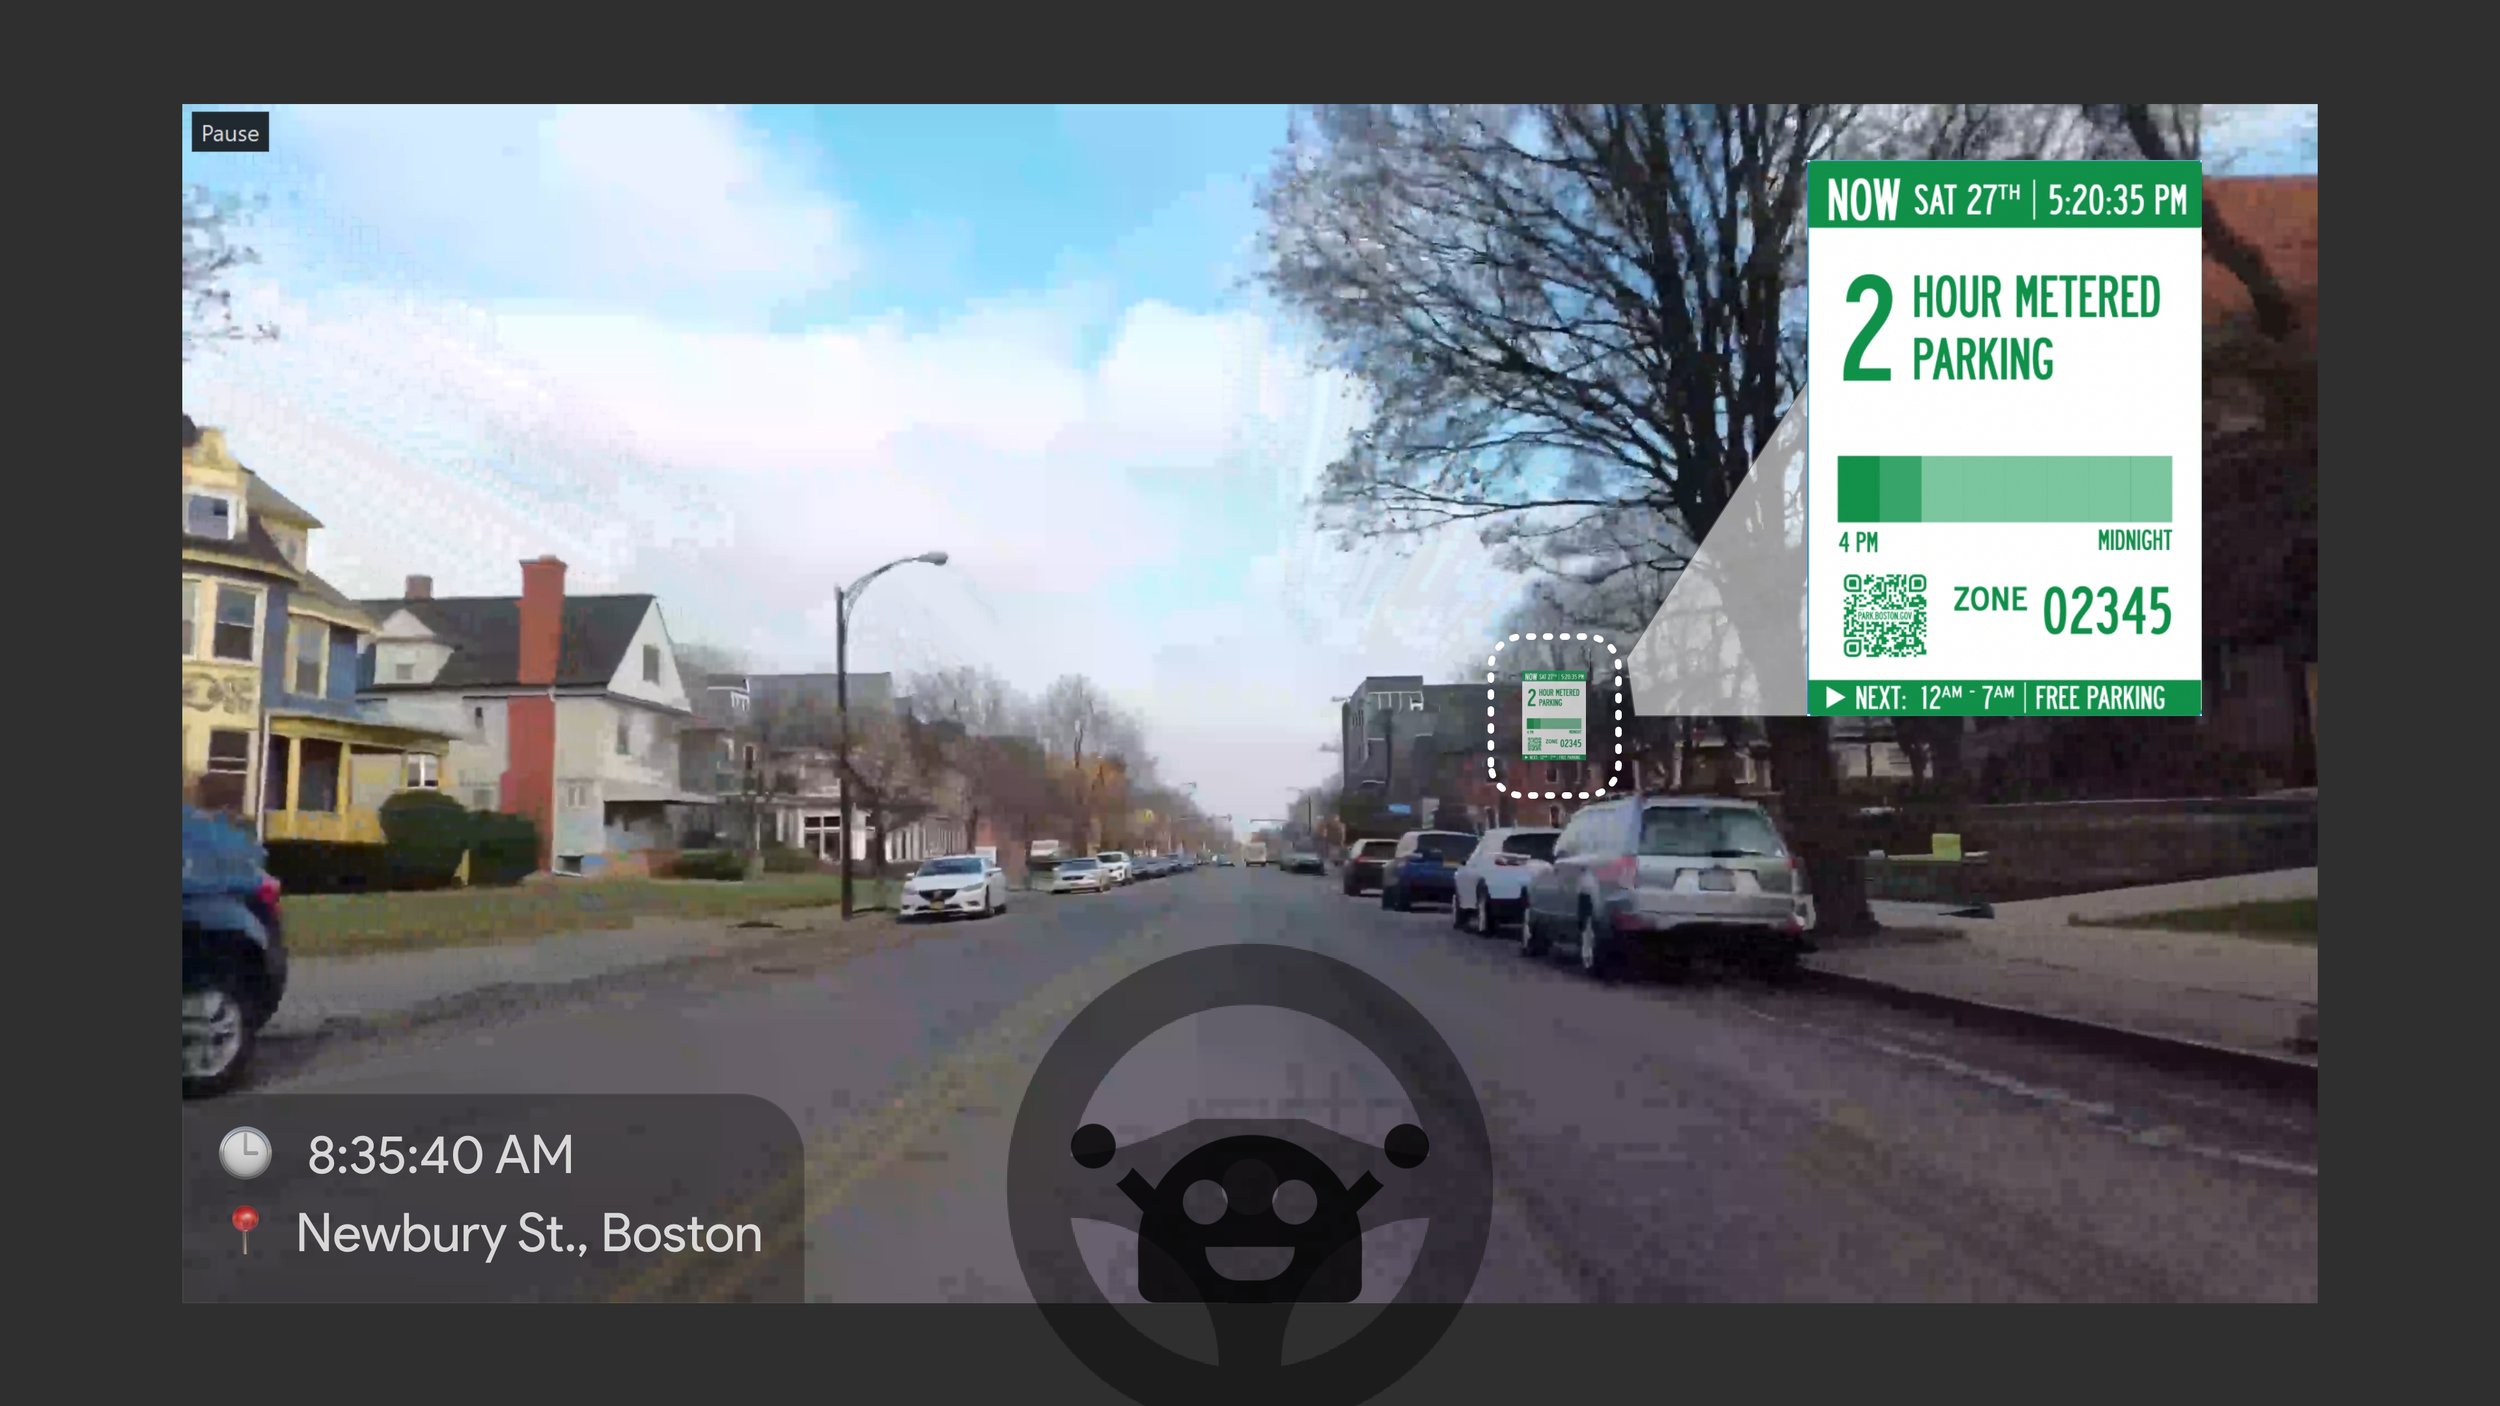
Desgin Hypothesis
Drivers in Boston would benefit from digital signage that increases their comprehension speed with regard to regulations and hours.
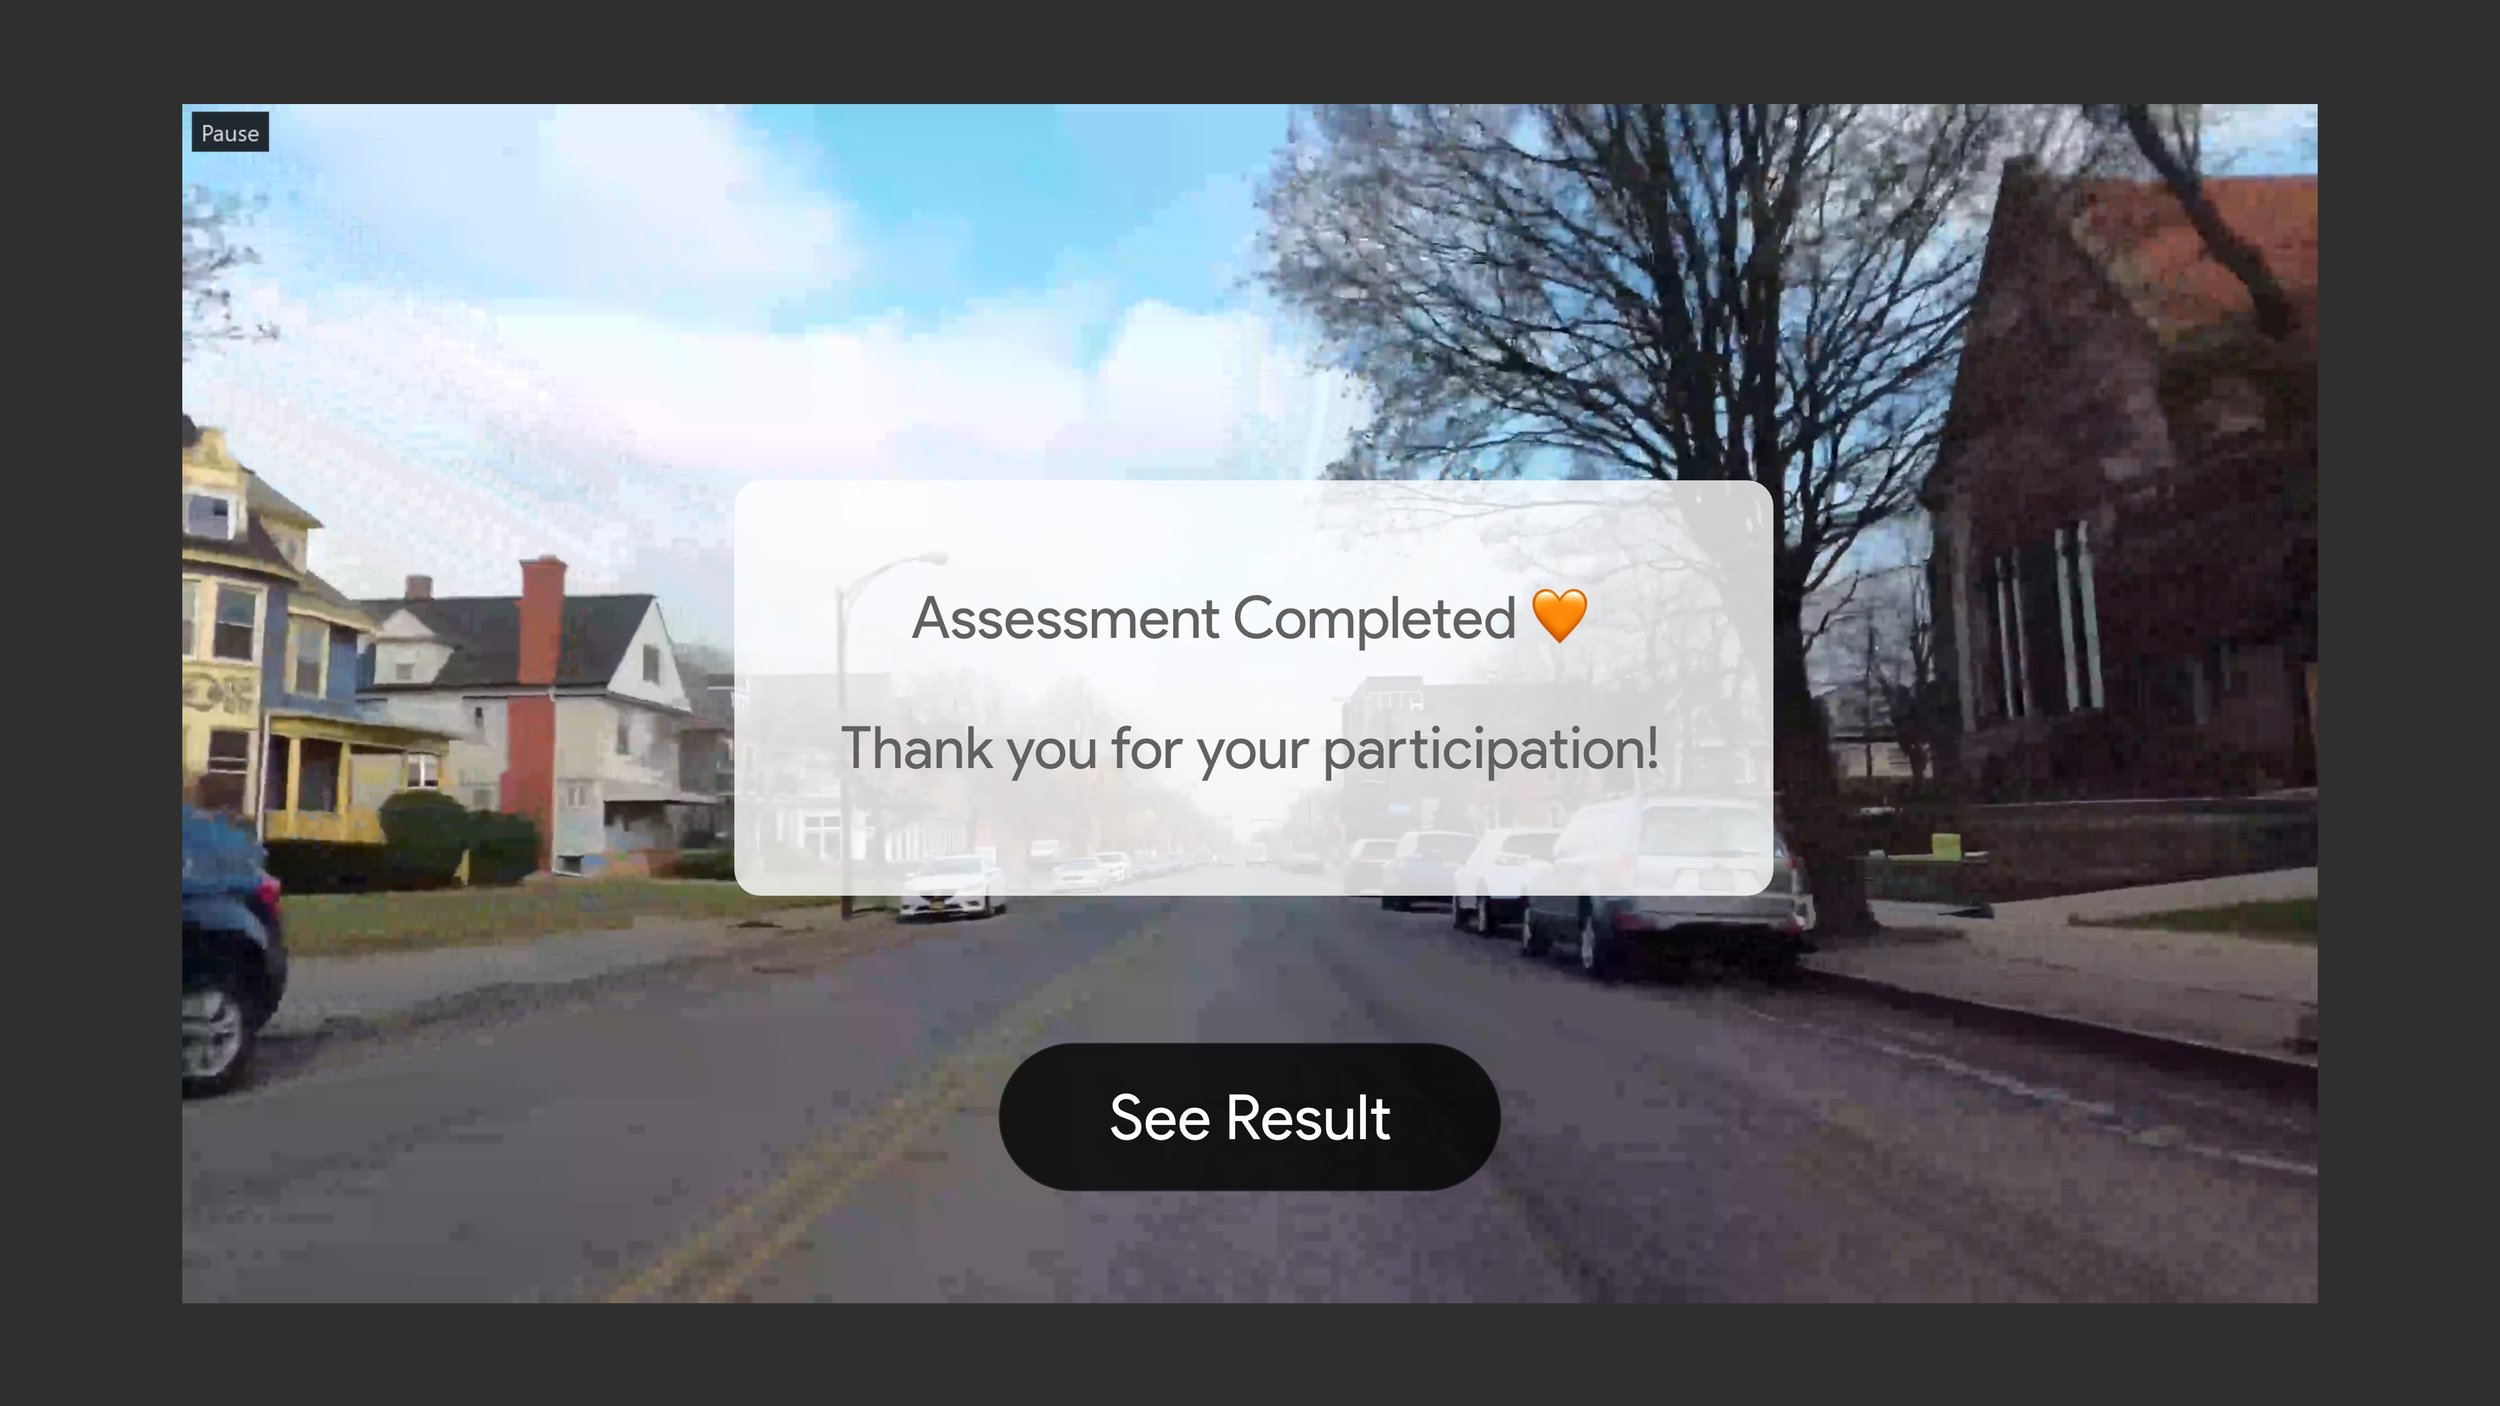
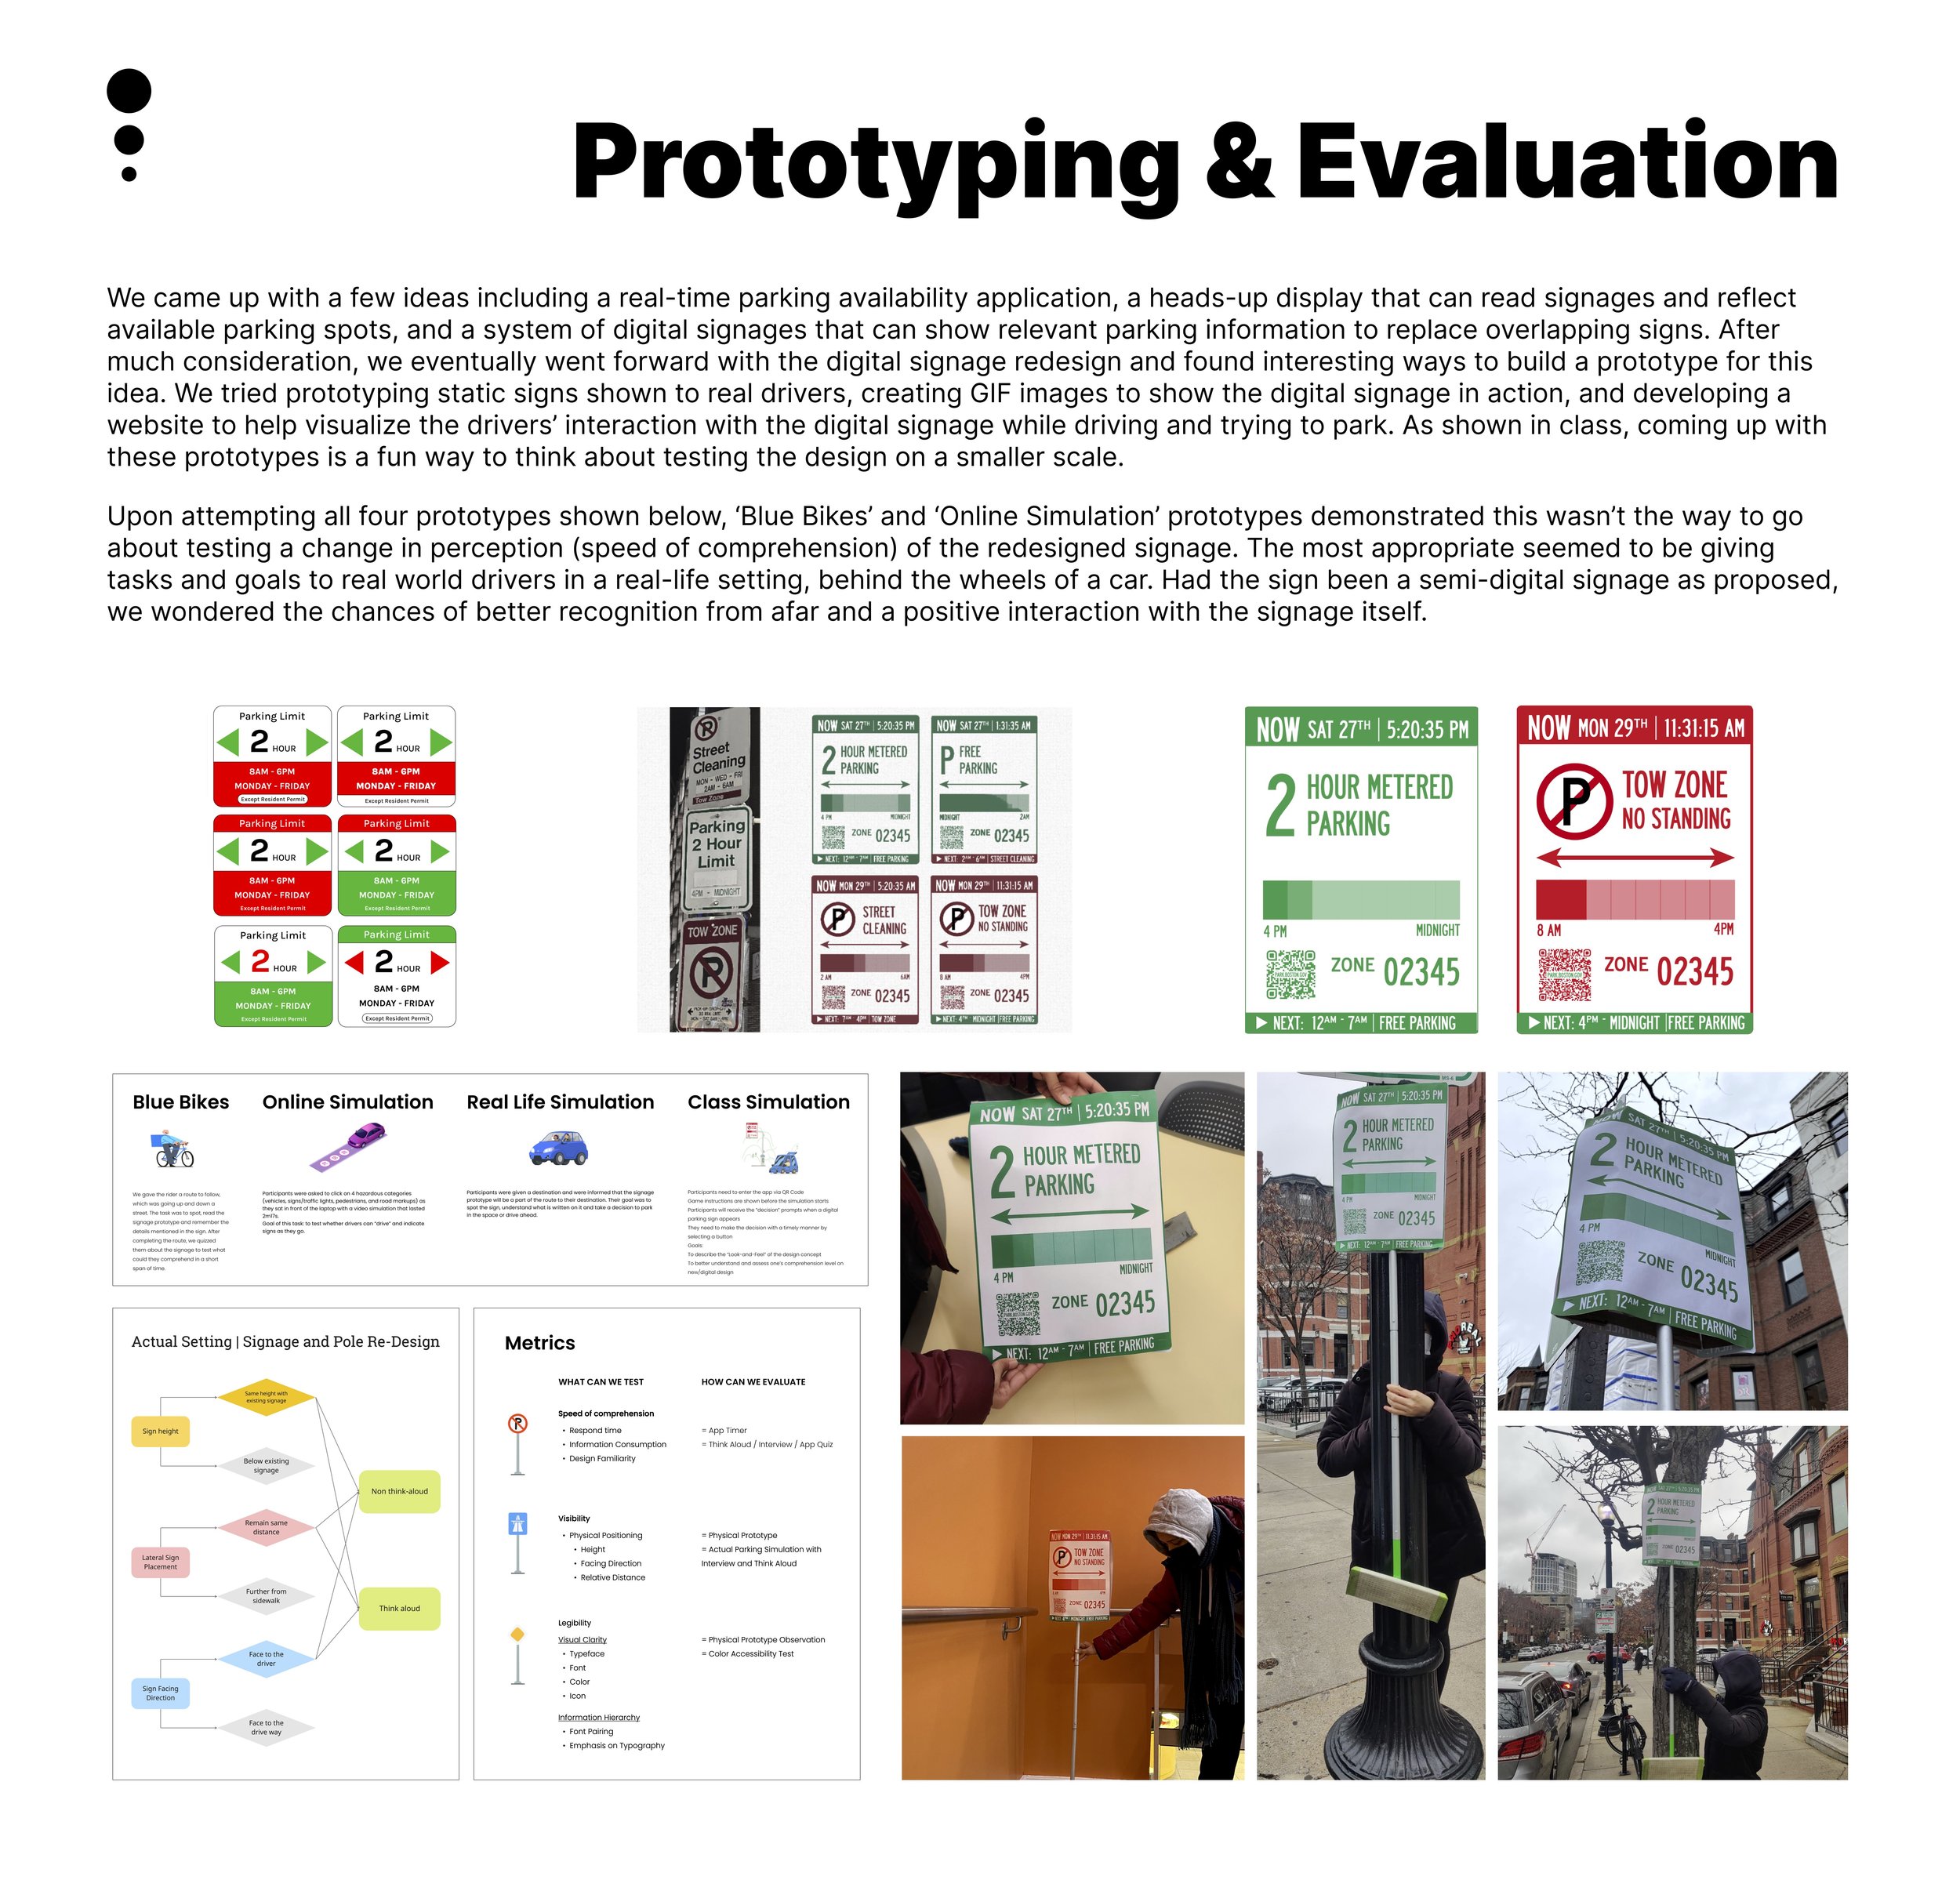
Results and Implications
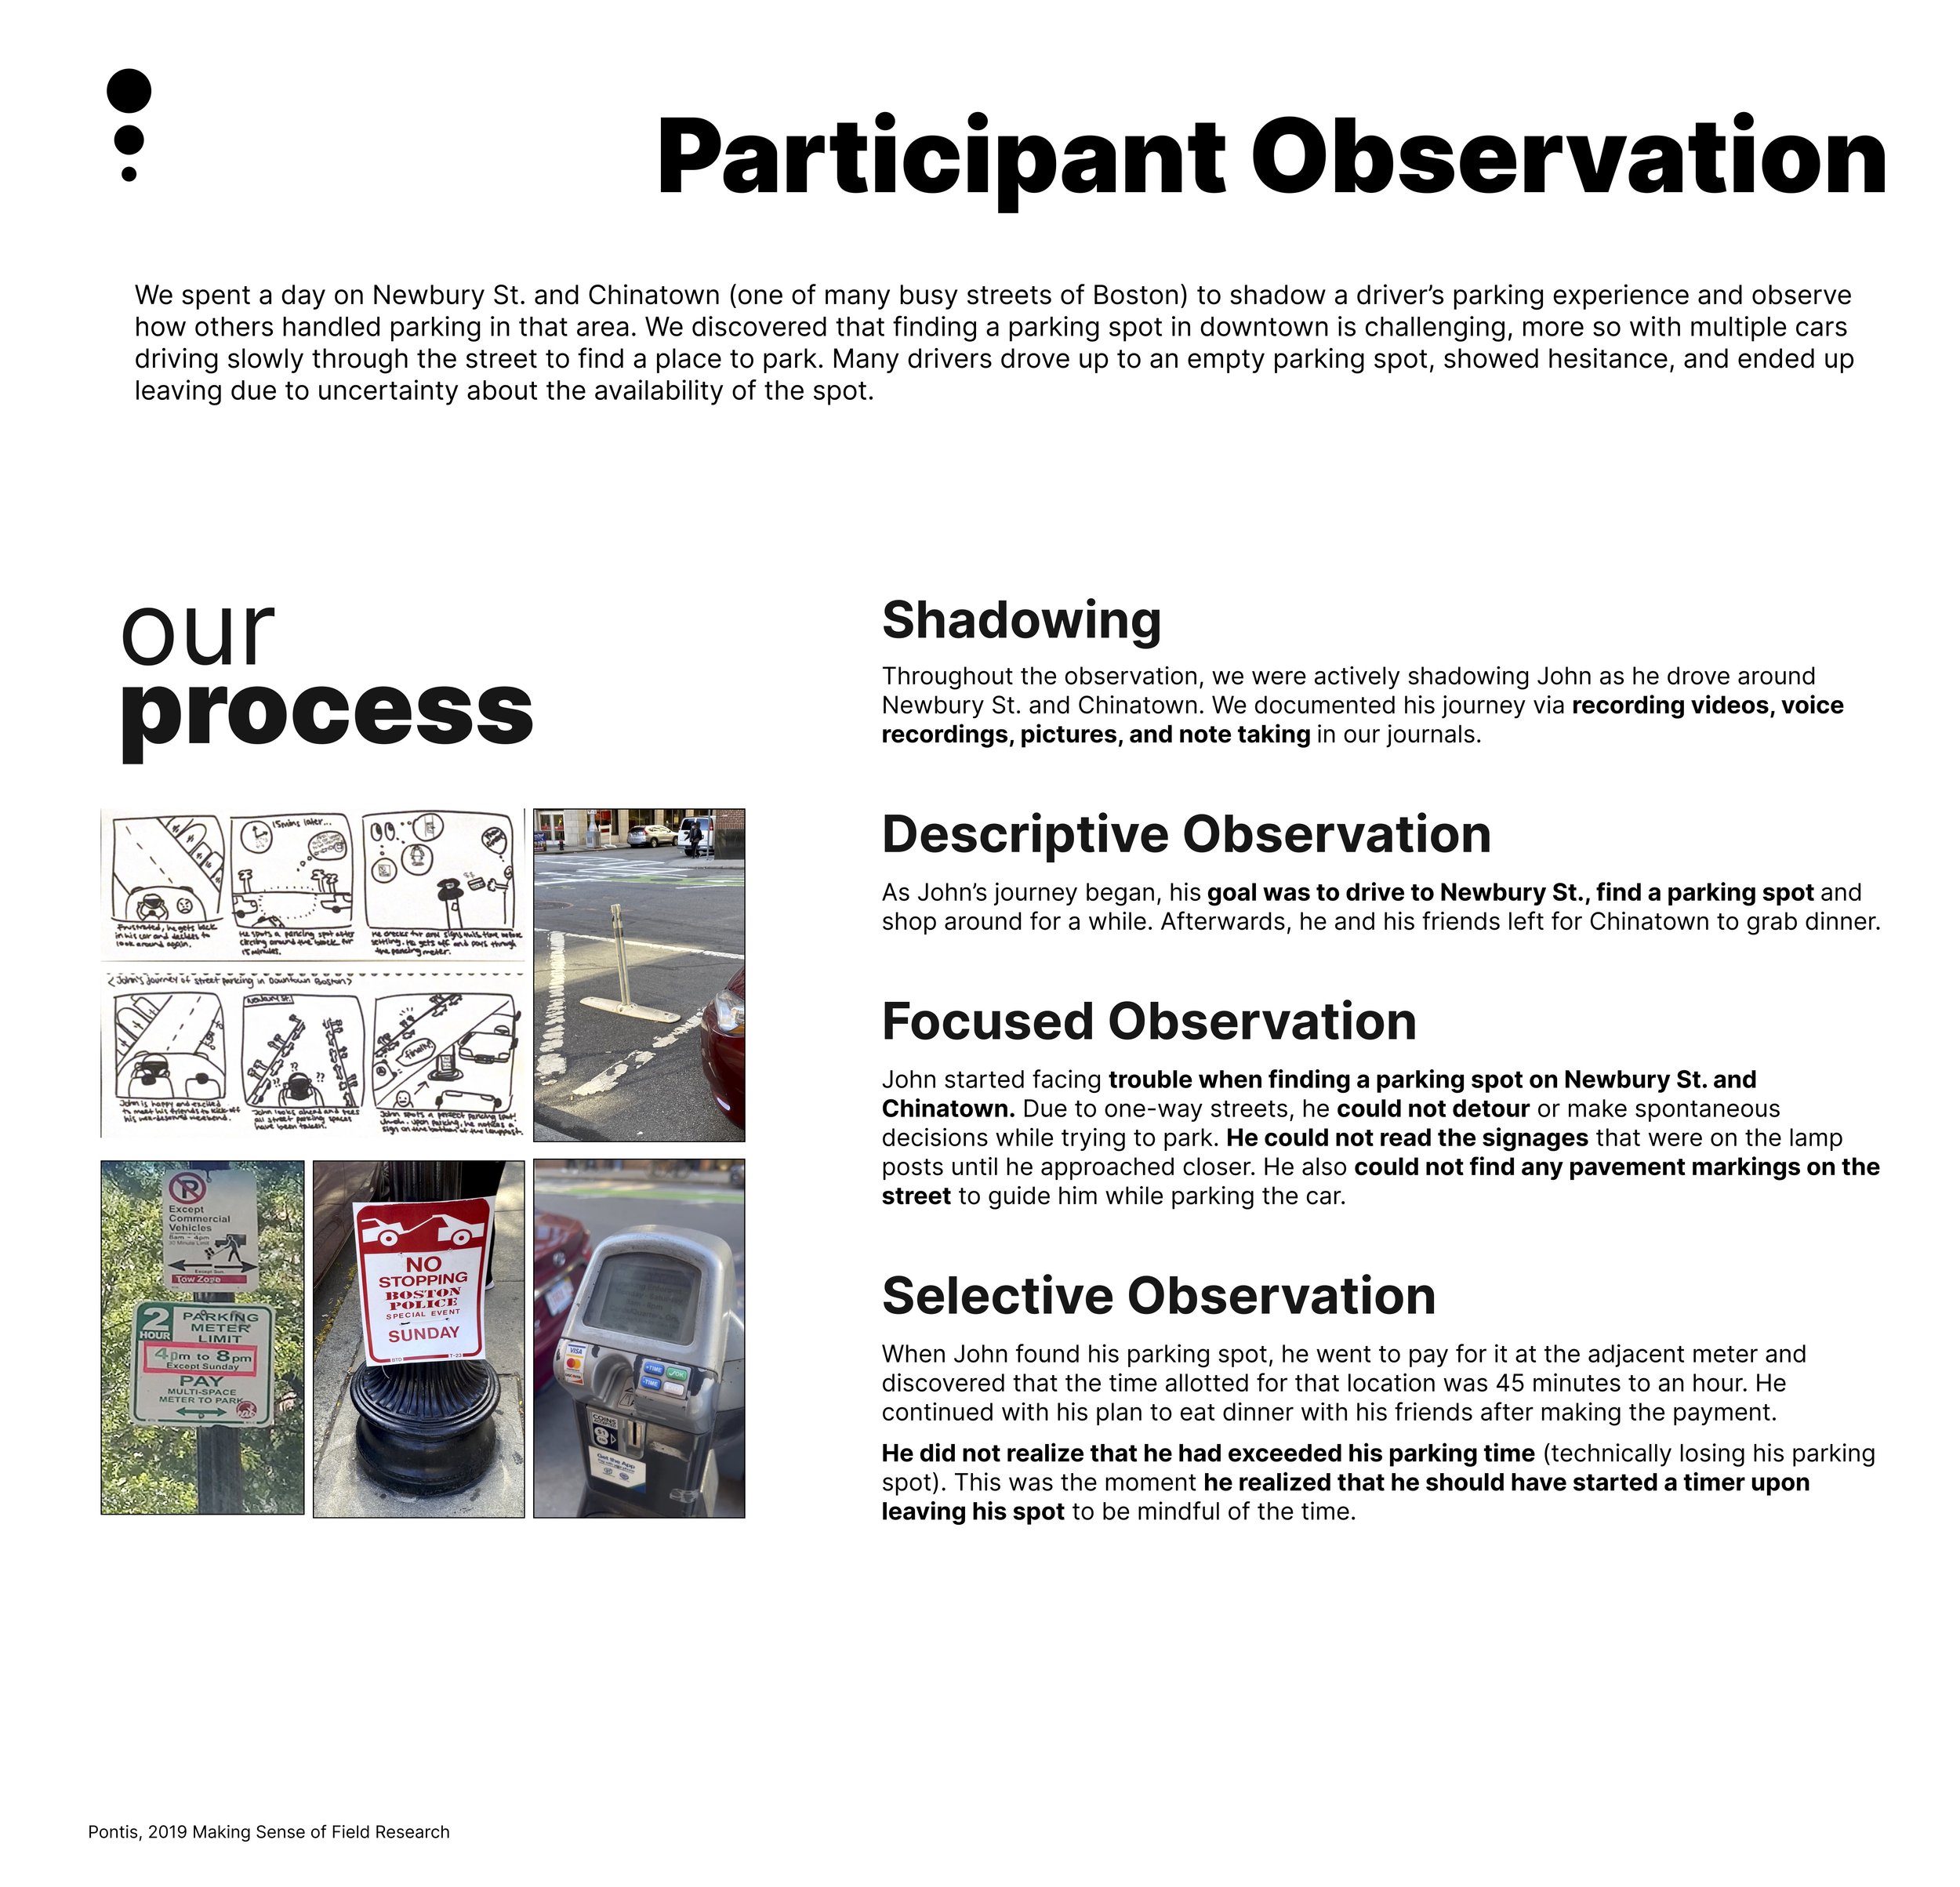
After two days of testing in different locations in Downtown Boston (Newbury Street and Chinatown), we received over 15 positive feedbacks from nearby pedestrians, especially on the effective visual communication. We have carefully recorded these insights for potential development in the next stages.
This feedback also strongly indicates a need for improvement in signage design in the city of Boston.


Synthesis & Analysis
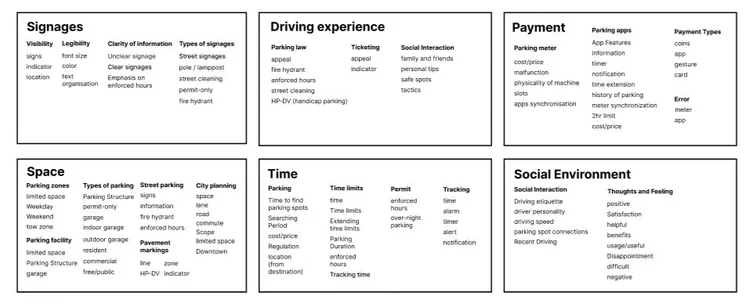
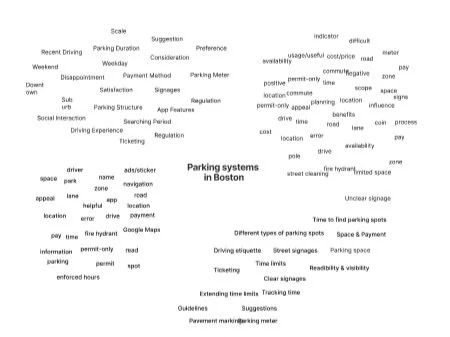
Codebook and Themes
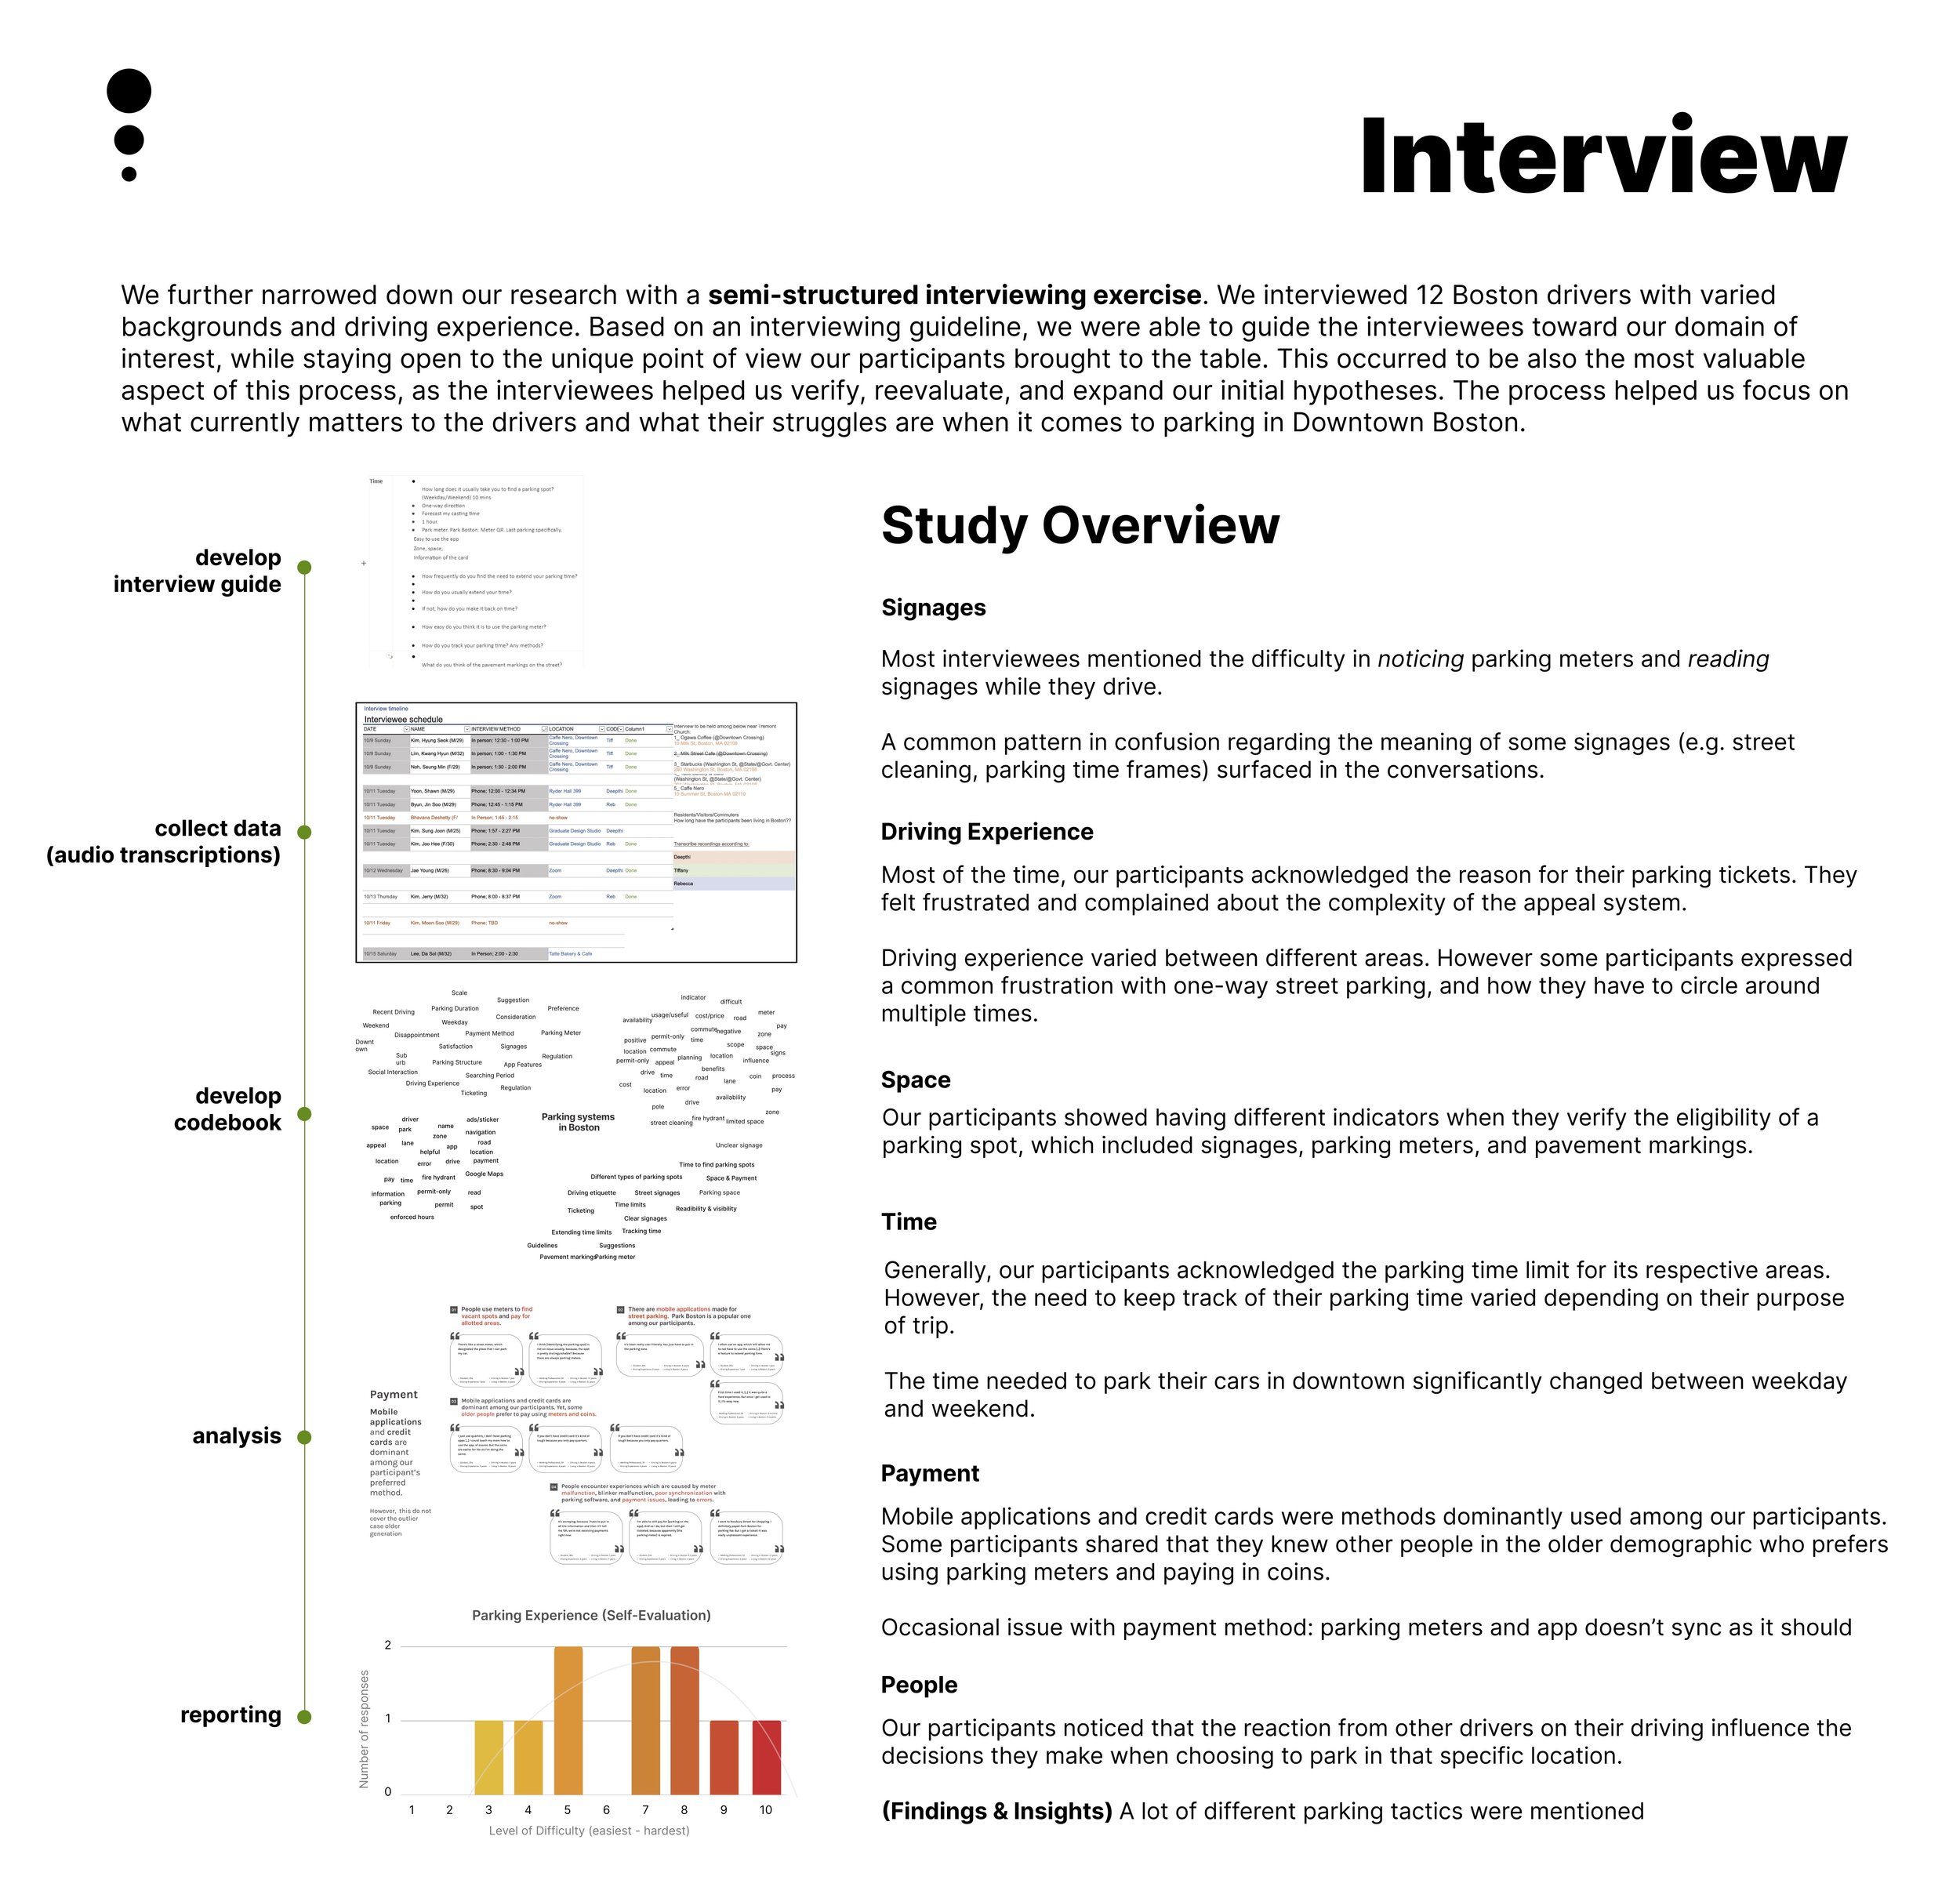
After gathering all participants' interviews and recordings, we developed a codebook to identify themes and codes, uncovering essential insights:
💡 Significance of Indicator:
Our participants identify signages (80%) as the first indicator of a parking spot, followed by parking meters (40%) and, contradicting our initial thesis, pavement markings (only 10%).
💡 Role of Social Environment:
This emerges as our new code. This involves noticing other drivers’ behavior (30%), asking friends for parking references (30%), and having their preferred parking spots (20%).
Takeaways
Incorporating Social Aspects: Noticing other drivers' behavior and seeking parking advice from friends highlight the social dynamics of parking. Future parking solutions should consider integrating social and community-based elements for better user engagement and satisfaction.
Coding Techniques: When approaching data analysis, it's beneficial to first familiarize oneself with the data thoroughly, then identify categories, and finally derive meaningful insights. This approach ensures a comprehensive understanding and accurate interpretation of the data.
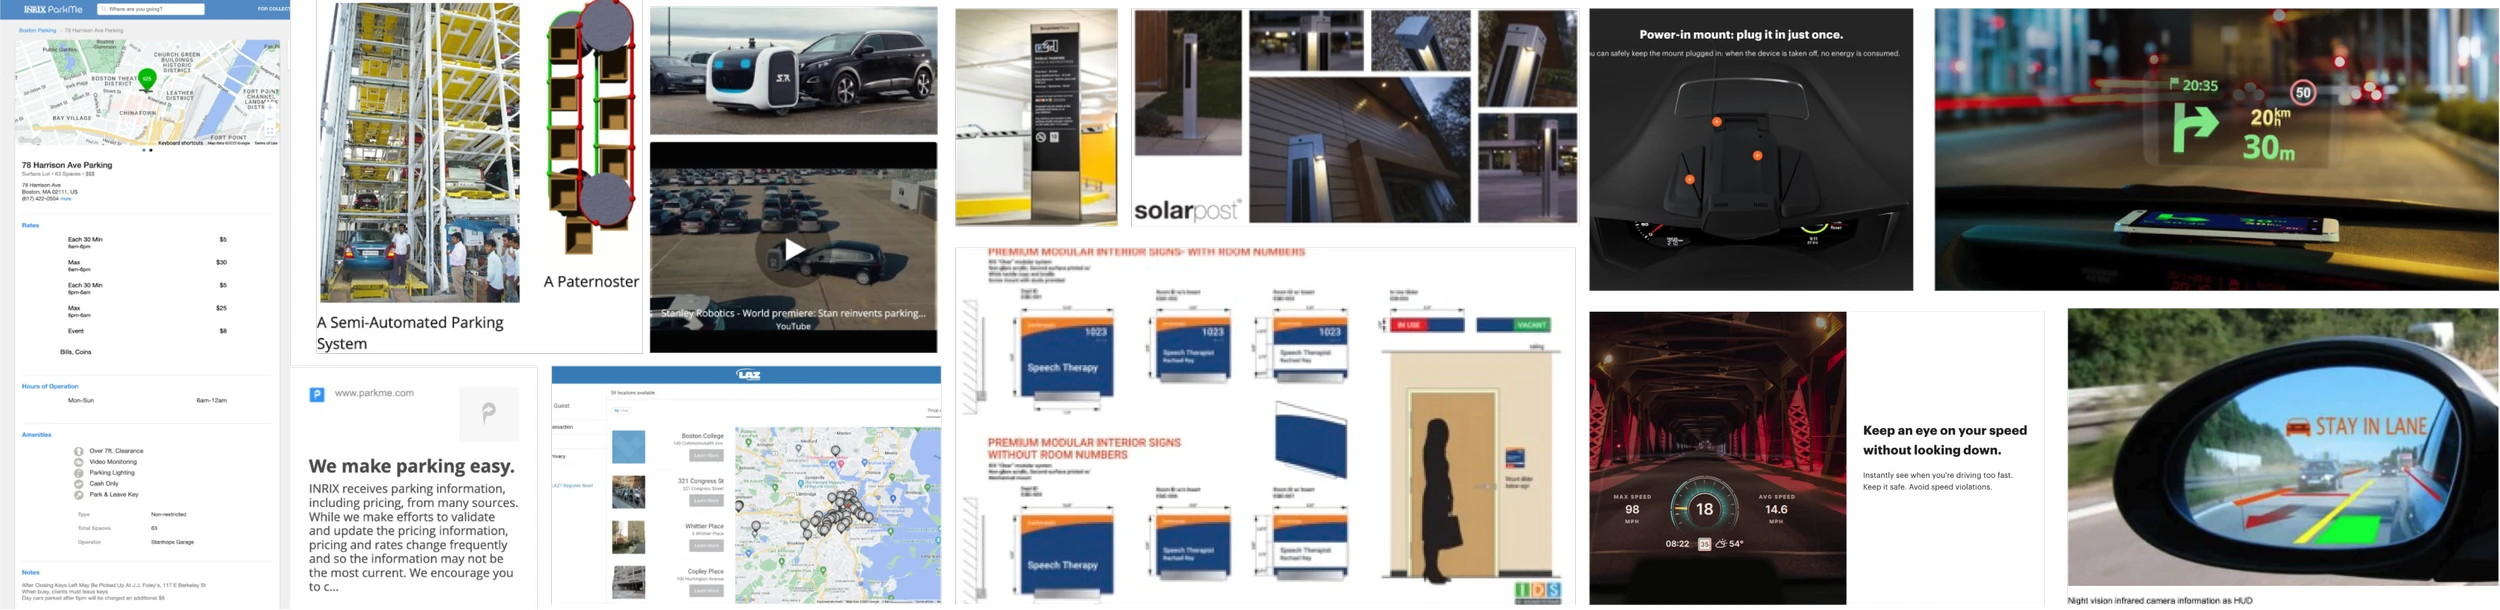
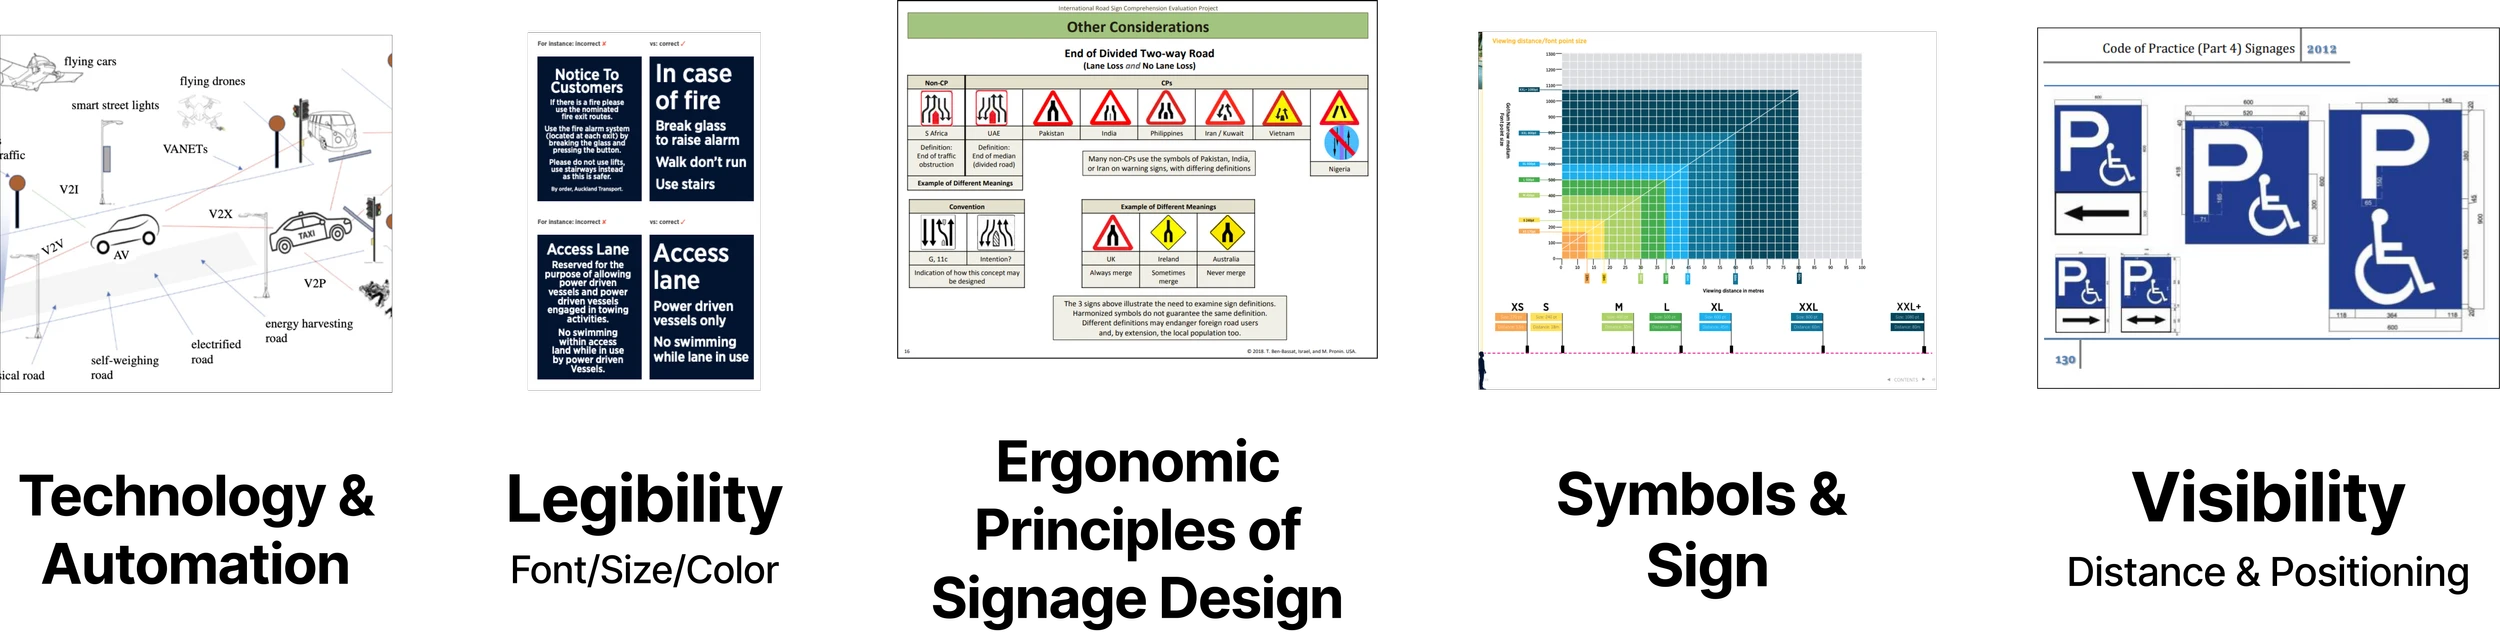
Precedents Library and Taxonomy
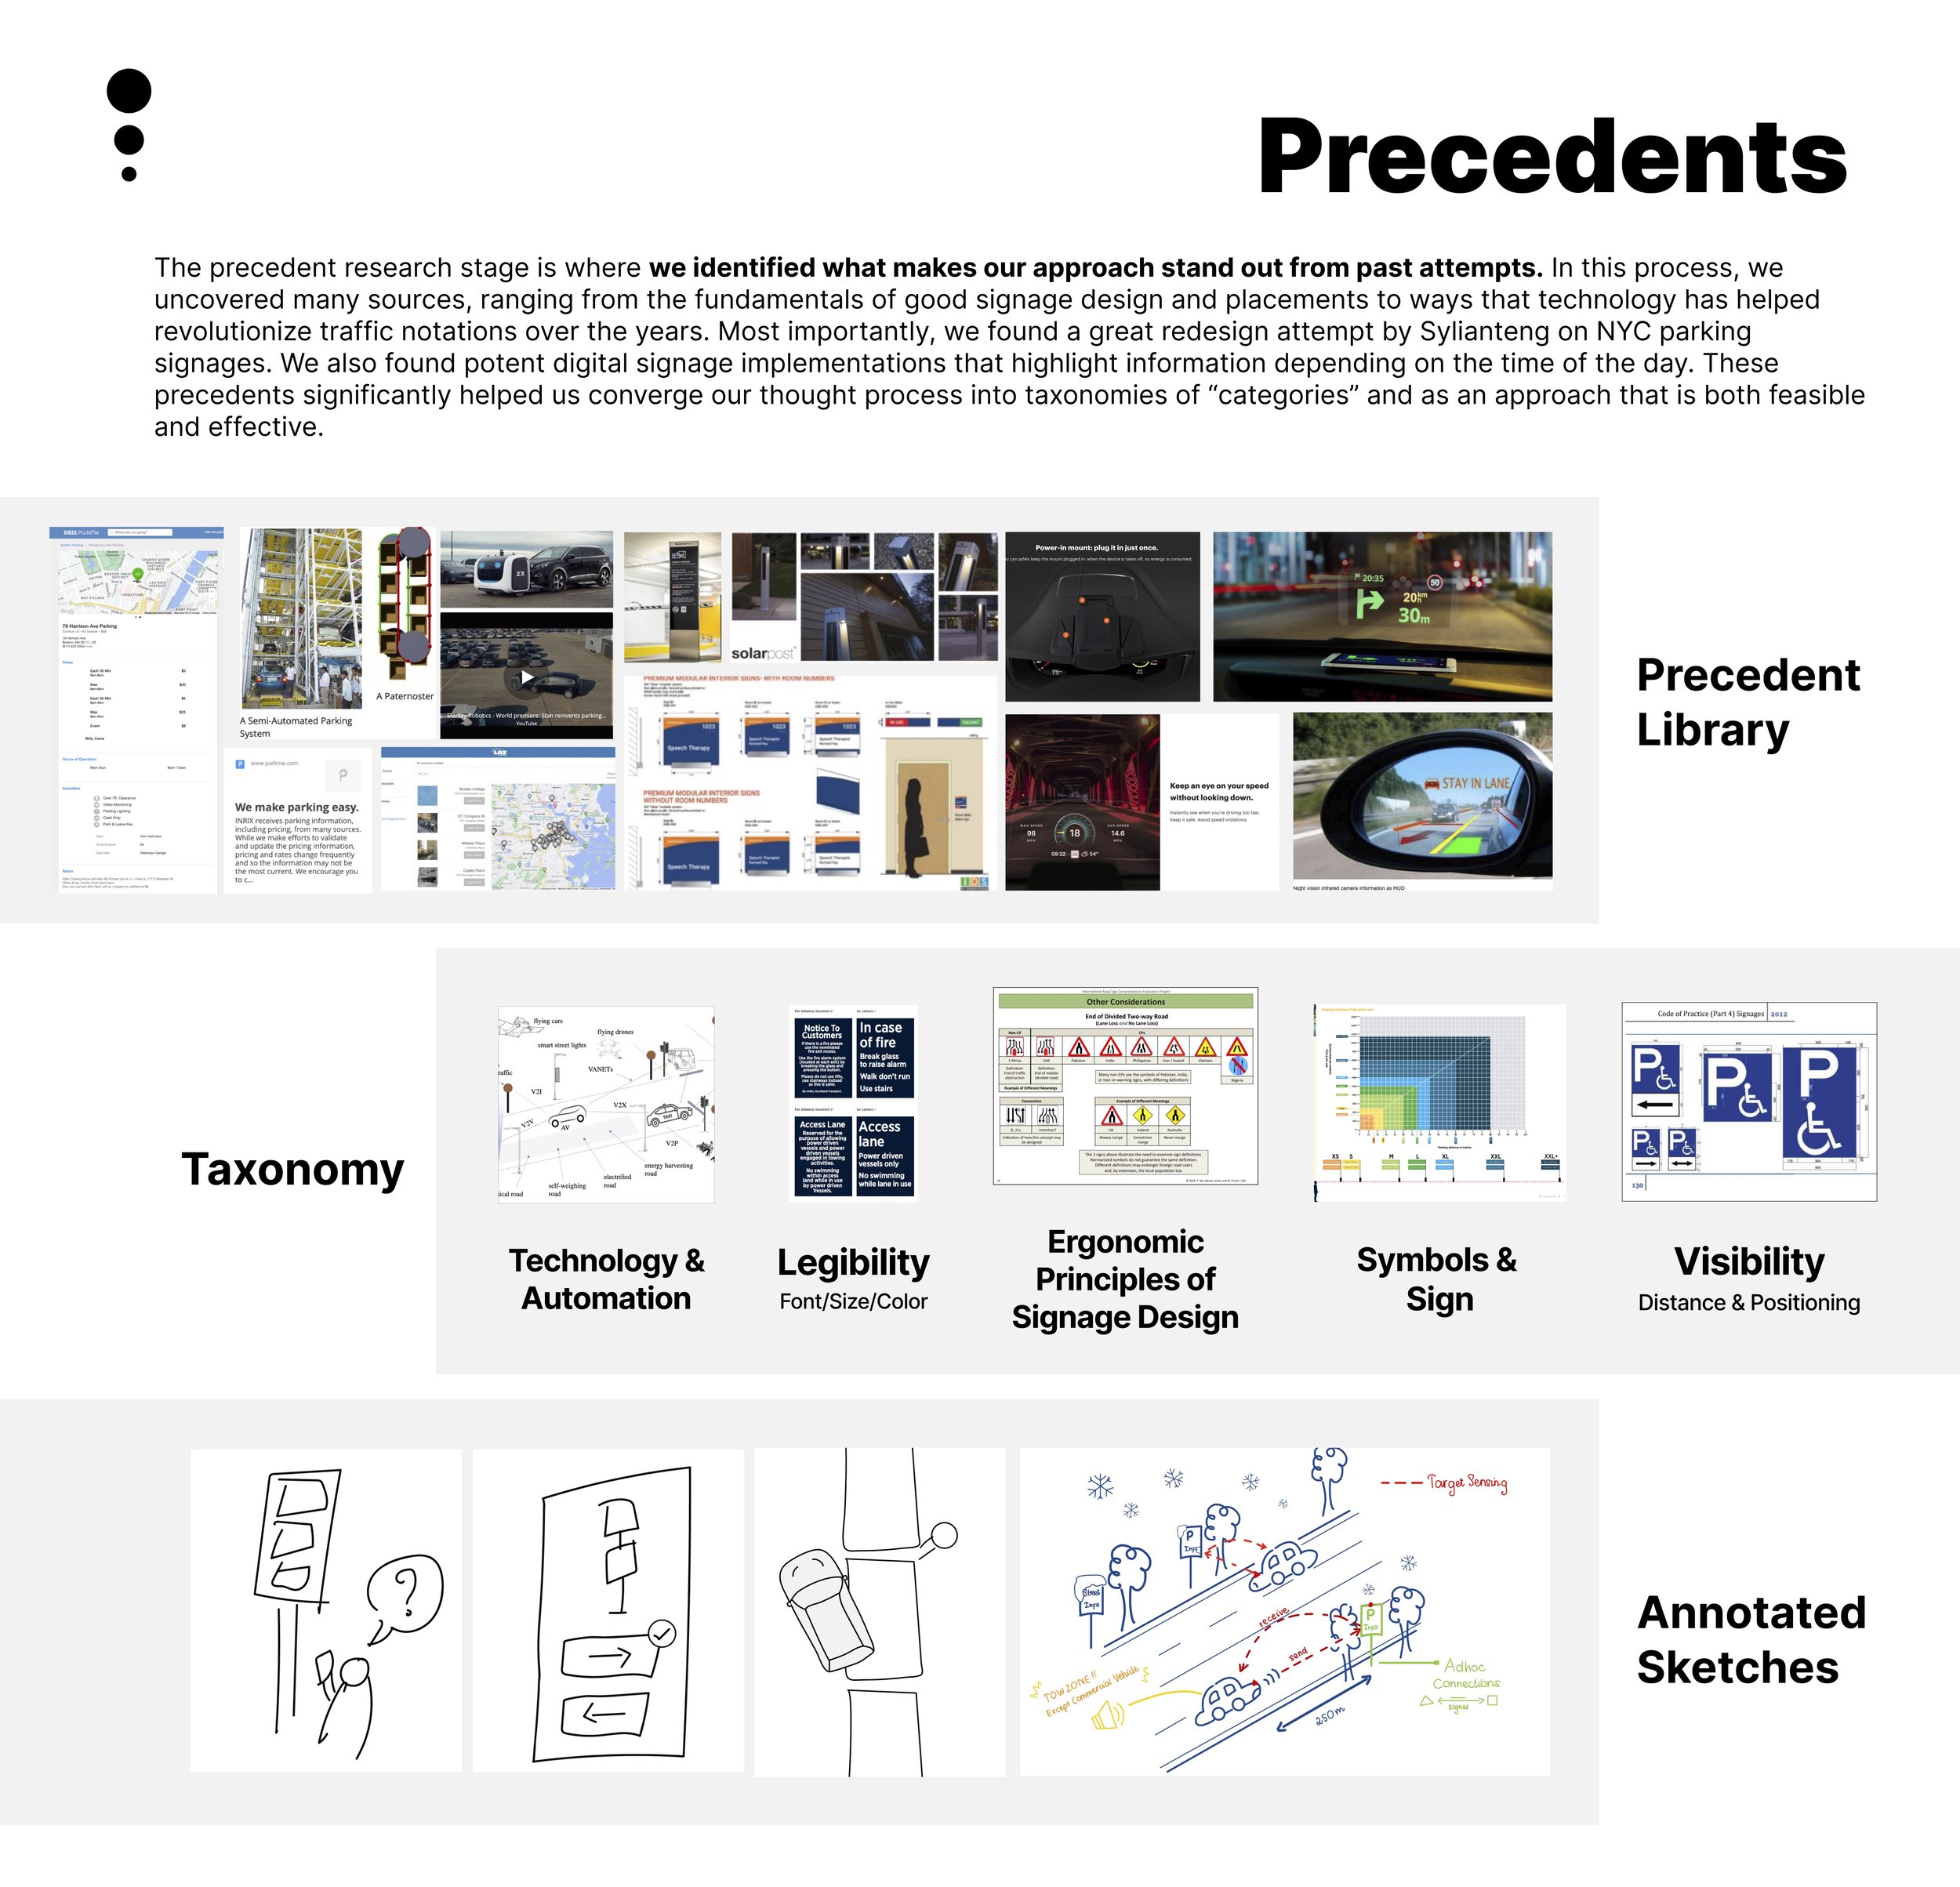
The way we come up with topics and categories critically impacts later design ideations. Therefore, we begin with a thorough examination of precedents to effectively scope our research findings and refer to insights that are most relevant.
Takeaways
Diversifying Sources: It's crucial to broaden our sources of information to gain diverse perspectives.
Key Questions to Consider:
Why hasn't our problem been solved already?
Understanding gaps in existing solutions can provide valuable insights for developing effective strategies.
What lessons or inspiration can we draw from prior work to ensure our approach will be successful?
Learning from past successes and failures can inform our approach and increase the chance of successful outcomes.